


Ethereum (ETHUSD) Is down 2.87% on Oct 13: What Are the Risk Factors?
Ethereum (ETHUSD) is down 2.87% at Oct 13 20:00(ET), now at $2444.63, with a 7-day down of 9.32%.
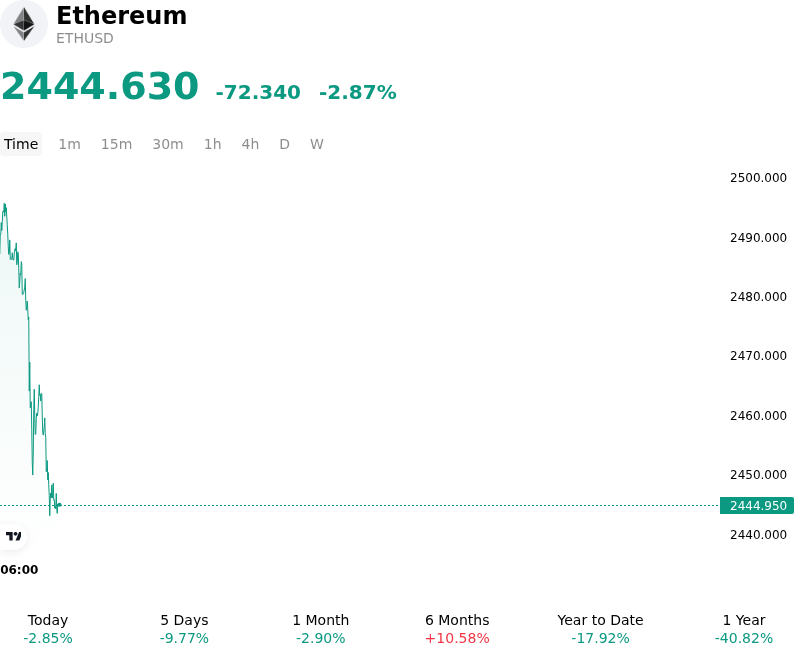
What is driving Ethereum (ETHUSD)’s stock price down today?
Ethereum experienced downside pressure as macro headwinds and persistent institutional outflows tightened liquidity across digital asset markets. A broader risk-off sentiment in global financial markets, driven by elevated Treasury yields and persistent inflationary concerns, curtailed investor appetite for high-beta assets. Crucially, institutional demand softened as spot Ether exchange-traded funds recorded sustained net redemptions, alongside a visible pause in corporate treasury accumulation. This pullback in institutional buying removed a primary market-clearing bid, leaving Ether vulnerable to broader macro repricing.
On-chain fundamentals and derivatives positioning further exacerbated the downward move. Network activity showed a deceleration in gas consumption and fee-burning mechanics, leading to a temporary expansion in net supply issuance and diluting the token's scarcity narrative. As spot prices fell through critical psychological support around key trading levels, automated liquidations of leveraged long positions surged across major exchanges. The forced unwind of long leverage created short-term order book imbalances, exacerbating price slippage in an environment of diminished order-book depth.
From a structural perspective, the retrenchment appears to reflect an event-driven leverage wash and macro liquidity adjustment rather than a fundamental breakdown of the network's long-term utility. Nevertheless, institutional investors continue to navigate headwinds related to tight monetary policy expectations and geopolitical uncertainty. Market participants will focus on stabilization in spot ETF flows, potential shifts in central bank liquidity guidance, and a rebound in protocol fee generation as prerequisites for a durable recovery in capital allocation.
Technical Analysis of Ethereum (ETHUSD)
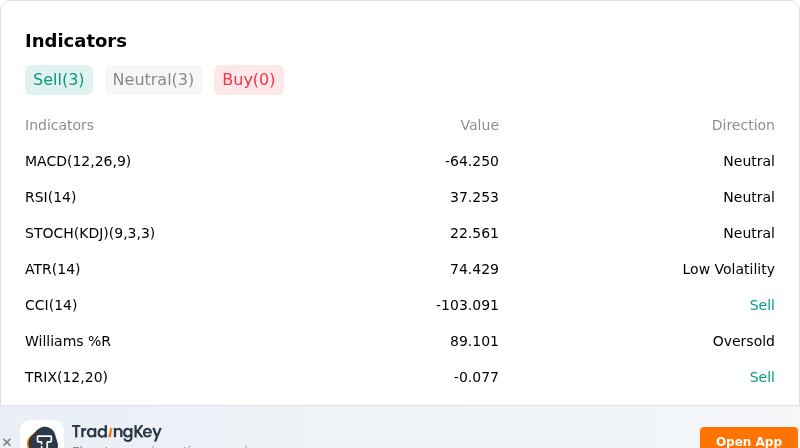
Technically, Ethereum (ETHUSD) shows a MACD (12,26,9) value of -64.250, indicating a neutral signal. The RSI at 37.253 suggests neutral condition and the Williams %R at 89.101 suggests oversold condition. Please monitor closely.
More details about Ethereum (ETHUSD)
Recent Events and Risks:
- Sustained Spot ETF Outflows: U.S. spot Ethereum ETFs have suffered nine consecutive sessions of net outflows totaling over $540 million, driven by heavy redemptions in BlackRock's ETHA and Grayscale's ETHE, severely eroding institutional spot demand and capping price recovery attempts.
- Elevated Leveraged Long Liquidation Pressure: Following over $165 million in long liquidations during the recent breach of technical support, derivatives open interest remains high at over $33 billion, with dense long liquidation clusters around $2,400 to $2,450 creating a severe threat of automated cascading sell-offs.
- Whale Long Margin Calls and Forced Selling Risk: Concentrated whale positions holding tens of thousands of ETH in leveraged longs face liquidation thresholds between $2,280 and $2,420, exposing the market to sudden liquidity shocks and forced spot dumping if lower price levels are tested.
- Macro Tightening and Declining Spot Liquidity: Firm U.S. Treasury yields and a stronger dollar continue to weigh on crypto market sentiment, while declining Ethereum spot trading volume has thinned market depth, increasing vulnerability to sharp downside slippage.
Recommended Articles


