


Nebius Group NV Stock (NBIS) Moved Down by 5.83% on Oct 12: What Investors Need To Know
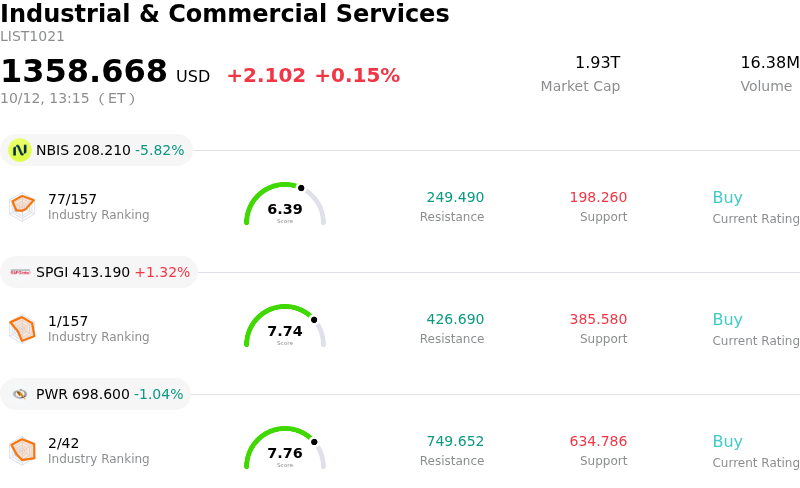
Nebius Group NV (NBIS) moved down by 5.83%. The Industrial & Commercial Services sector is up by 0.15%. The company underperformed the industry. Top 3 stocks by turnover in the sector: Nebius Group NV (NBIS) down 5.82%; S&P Global Inc (SPGI) up 1.32%; Quanta Services Inc (PWR) down 1.04%.
What is driving Nebius Group NV (NBIS)’s stock price down today?
Nebius Group N.V. experienced downward pressure and elevated intraday volatility as market sentiment toward artificial intelligence infrastructure providers deteriorated. Investors across the broader technology sector continue to reassess high-multiple neocloud operators amid growing scrutiny over capital expenditure efficiency, hardware depreciation cycles, and near-term returns on investment across the AI ecosystem. Macro headwinds, including sustained upward pressure on long-dated benchmark yields, further compressed equity valuations for capital-intensive growth firms that rely heavily on continuous capital deployment to expand cloud capacity.
Beyond sector-wide momentum shifts, company-specific factors compounded market caution. Concerns regarding potential equity dilution remain top of mind as Nebius aggressively expands its AI cloud footprint and GPU cluster capacity, requiring substantial ongoing capital expenditures relative to top-line generation. Recent regulatory filings detailing insider share sales by executive leadership to satisfy tax obligations upon unit vesting also weighed on investor sentiment, creating an additional supply overhang ahead of the upcoming quarterly financial release.
From a technical perspective, the intraday pullback breached key short-term moving averages, breaking recent momentum indicators and triggering systematic profit-taking. While the company maintains strong revenue expansion, key strategic cloud partnerships, and ongoing inorganic investments to enhance its software inference stack, current price action underscores a period of valuation digestion. Institutional market participants appear to be de-risking positions, awaiting further visibility into customer prepayment velocity, GPU utilization rates, and margin trajectory amid an increasingly competitive AI hardware landscape.
Technical Analysis of Nebius Group NV (NBIS)
Technically, Nebius Group NV (NBIS) shows a MACD (12,26,9) value of -5.796, indicating a neutral signal. The RSI at 42.242 suggests neutral condition and the Williams %R at 98.628 suggests oversold condition. Please monitor closely.
Fundamental Analysis of Nebius Group NV (NBIS)
Nebius Group NV (NBIS) is in the Industrial & Commercial Services industry. Its latest annual revenue is $529.80M, ranking 113 in the industry. The net profit is $82.50M, ranking 74 in the industry. Company Profile
Over the past month, multiple analysts have rated the company as Buy, with an average price target of $291.20, a high of $410.00, and a low of $144.00.
More details about Nebius Group NV (NBIS)
Company Specific Risks:
- Heavy Insider Liquidations: Market sentiment has been severely dampened by massive insider share sales, highlighted by COO Ophir Nave disposing of 500,000 shares worth approximately $118 million, raising institutional concerns over management's outlook on the current stock valuation.
- Accelerated GPU Depreciation and Capex Burdens: Nebius faces mounting profit margin strain as it spends heavily on AI compute infrastructure, recording $259 million in depreciation expenses against $582 million in revenue amid growing scrutiny regarding the fast-shortening economic lifespan of GPU hardware.
- AI Compute Monetization Skepticism: Valuation pressure on neocloud providers has escalated following reports that key AI driver OpenAI posted annualized revenues well below prior market expectations, sparking broader skepticism around long-term utilization rates and infrastructure ROI.
- Dilution Risk and Financing Sensitivity: Nebius's multi-billion-dollar infrastructure expansion plans leave the company heavily dependent on capital markets, creating ongoing share dilution risks following its $2 billion equity issuance and increasing vulnerability to high debt-servicing costs.
Recommended Articles


