


Ciena Corp Stock (CIEN) Moved Down by 9.89% on Oct 12: Key Drivers Unveiled
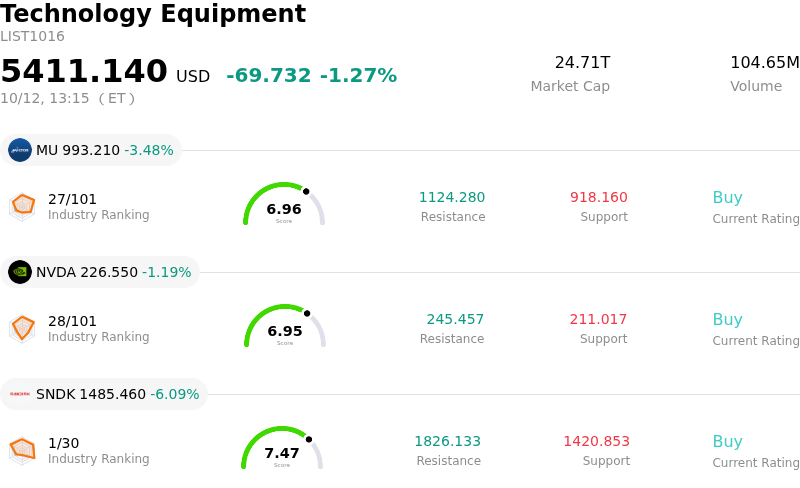
Ciena Corp (CIEN) moved down by 9.89%. The Technology Equipment sector is down by 1.27%. The company underperformed the industry. Top 3 stocks by turnover in the sector: Micron Technology Inc (MU) down 3.47%; NVIDIA Corp (NVDA) down 1.19%; SanDisk Corporation (SNDK) down 6.12%.
What is driving Ciena Corp (CIEN)’s stock price down today?
Ciena Corporation experienced significant downward intraday volatility, largely driven by aggressive profit-taking and valuation compression following a multi-week rally powered by artificial intelligence infrastructure enthusiasm. The stock had expanded to premium valuation multiples, significantly outstripping broader communications hardware peers. This elevated valuation heightened sensitivity to shifts in technology sector sentiment, making the shares particularly vulnerable to swift pullbacks as institutional investors locked in gains following recent upward momentum.
Fundamentally, while demand for optical networking equipment remains robust across cloud hyperscalers—which now account for roughly half of Ciena’s business—investors are increasingly focused on component supply constraints. Although the company maintains a massive order backlog, persistent supply chain bottlenecks continue to cap near-term revenue conversion speed. Management's commentary indicating that supply-demand imbalances could extend into upcoming fiscal quarters has fueled concerns over near-term delivery timelines, creating friction against high market expectations.
Additionally, heavy customer concentration among top cloud operators exposes Ciena to market debate surrounding the immediate return on investment and rollout schedules of AI data-center infrastructure. Market sentiment is balancing long-term capacity expansion against potential near-term lulls in optical transport deployment. Any perceived timing mismatch between continuous capital investment and near-term operating margin expansion prompts tactical selling among institutional market participants.
From an institutional perspective, Ciena’s fundamental narrative remains supported by strong secular tailwinds in high-speed optical connectivity and rising network traffic. However, premium valuation multiples coupled with operational supply constraints mean the stock remains susceptible to sharp volatility. Key factors for investors to monitor going forward include quarterly order conversion efficiency, component supply chain stabilization, and hyperscaler capital spending plans.
Technical Analysis of Ciena Corp (CIEN)
Technically, Ciena Corp (CIEN) shows a MACD (12,26,9) value of 16.930, indicating a buy signal. The RSI at 54.300 suggests neutral condition and the Williams %R at 43.023 suggests buy condition. Please monitor closely.
Fundamental Analysis of Ciena Corp (CIEN)
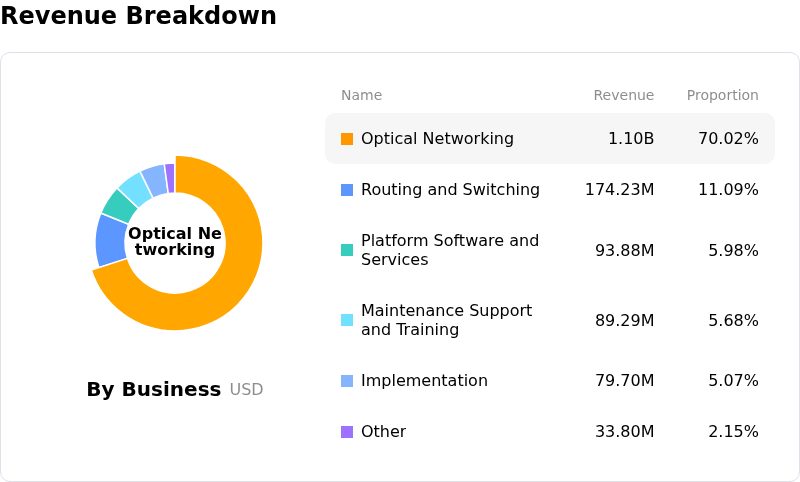
Ciena Corp (CIEN) is in the Technology Equipment industry. Its latest annual revenue is $4.77B, ranking 9 in the industry. The net profit is $123.34M, ranking 14 in the industry. Company Profile
Over the past month, multiple analysts have rated the company as Buy, with an average price target of $509.85, a high of $660.00, and a low of $323.44.
More details about Ciena Corp (CIEN)
Company Specific Risks:
- Extremes in Valuation Multiples: Trading near 99 times trailing earnings after a extended sector repricing, the stock faces severe downside volatility as quantitative valuation models and institutional reports flag overbought technical conditions and high multiples that leave no room for execution missteps.
- Margin Compression and Accretion Vulnerability: Wall Street research, including recent price target cuts from analysts citing gross margin headwinds, highlights concerns that record peak operating margins may be unsustainable as input costs rise and product deployment mixes shift.
- Hyperscaler Capex Rationalization & Backlog Deceleration: Analysts cite growing downside risk of slower order momentum and backlog rationalization as telecommunication carriers and cloud providers pace capital expenditures while waiting for downstream high-capacity network demand to ramp up.
- Persistent Insider Dispositions: SEC Form 4 and Form 144 filings reveal ongoing insider liquidations by key executives, including CFO Marc Graff and EVP Jason Phipps, which contribute to negative sentiment and pressure intraday share performance.
Recommended Articles


