


Bristol-Myers Squibb Co Stock (BMY) Moved Down by 3.35% on Oct 12: What Signal Does It Send?
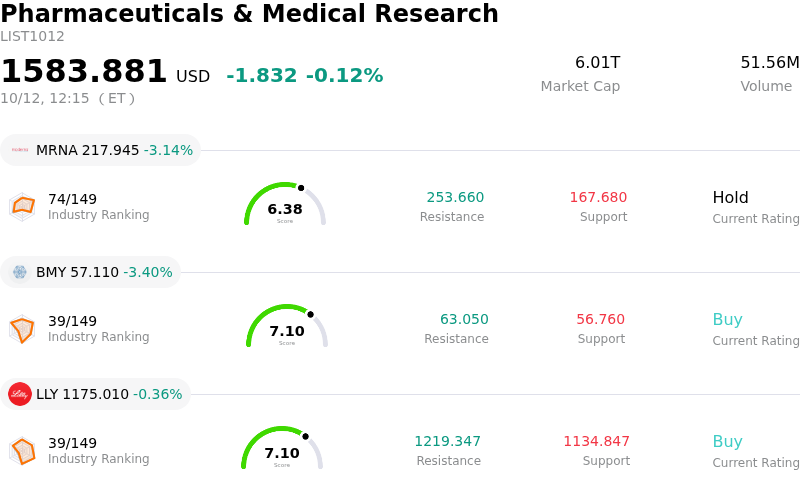
Bristol-Myers Squibb Co (BMY) moved down by 3.35%. The Pharmaceuticals & Medical Research sector is down by 0.12%. The company underperformed the industry. Top 3 stocks by turnover in the sector: Moderna Inc (MRNA) down 3.14%; Bristol-Myers Squibb Co (BMY) down 3.40%; Eli Lilly and Co (LLY) down 0.36%.
What is driving Bristol-Myers Squibb Co (BMY)’s stock price down today?
Bristol-Myers Squibb experienced notable intraday volatility, initially advancing in early trading before reversing direction to end the session in negative territory. The early surge was sparked by headlines highlighting positive Phase 3 clinical trial outcomes, but enthusiasm waned as market participants digested the specific trial parameters and engaged in profit-taking following the initial price pop.
The core catalyst behind the day's activity was a dual release of late-stage clinical data. The company announced that its targeted radiopharmaceutical candidate RYZ101 met its primary endpoint by delivering a statistically significant improvement in progression-free survival for patients with gastroenteropancreatic neuroendocrine tumors. Simultaneously, the Phase 3 ALOFT-IPF trial evaluating admilparant for idiopathic pulmonary fibrosis achieved its primary endpoint at the lower dose level. However, sentiment turned cautious after details revealed that the higher dose cohort of admilparant failed to reach statistical significance. The lack of complete quantitative datasets in the initial press releases further prompted investors to adopt a wait-and-see approach regarding the drug's commercial profile.
From a strategic perspective, the stock's price reversal reflects broader market sensitivity to pipeline execution. As Bristol-Myers Squibb navigates impending patent expirations for key cornerstone therapies, investors remain laser-focused on the clinical robust performance of replacement assets. Although the trial milestones mark progress toward potential regulatory filings, mixed efficacy metrics at higher dose tiers and general profit-taking ultimately weighed on sentiment, driving the stock lower by the close.
Technical Analysis of Bristol-Myers Squibb Co (BMY)
Technically, Bristol-Myers Squibb Co (BMY) shows a MACD (12,26,9) value of -0.665, indicating a sell signal. The RSI at 29.182 suggests sell condition and the Williams %R at 95.354 suggests oversold condition. Please monitor closely.
Fundamental Analysis of Bristol-Myers Squibb Co (BMY)
Bristol-Myers Squibb Co (BMY) is in the Pharmaceuticals & Medical Research industry. Its latest annual revenue is $48.19B, ranking 11 in the industry. The net profit is $7.05B, ranking 12 in the industry. Company Profile
Over the past month, multiple analysts have rated the company as Buy, with an average price target of $65.89, a high of $82.00, and a low of $41.00.
More details about Bristol-Myers Squibb Co (BMY)
Company Specific Risks:
- Mixed Trial Results and Tolerability Concerns for Pipeline Lead Admilparant: Topline Phase 3 ALOFT-IPF trial data revealed that while the 60 mg dose achieved its primary endpoint, the higher 120 mg dose failed to demonstrate statistical significance, renewing institutional concerns surrounding trial protocol amendments and safety profiles.
- Institutional Analyst Downgrades and Market Resistance: Wall Street research firms, including Leerink Partners lowering BMY to Market Perform, cite elevated debt levels and strong market headwinds as key factors capping equity upside despite recent positive pipeline readouts.
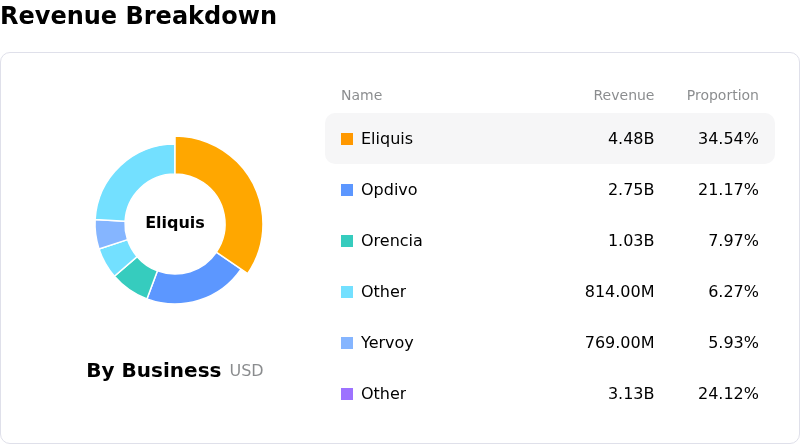
- Accelerating Legacy Drug Revenue Erosion and Loss of Exclusivity: Upcoming patent expiration cliffs for cornerstone blockbusters Eliquis and Opdivo, alongside generic erosion of Revlimid and Medicare Inflation Reduction Act price caps, threaten to displace over half of the company's core revenue base over the next several years.
- Capital Structure Strain and Slow Monetization of Acquired Assets: Heavy debt obligations resulting from multi-billion-dollar acquisitions, including the $14 billion buyout of Karuna Therapeutics, present financial execution risks while new commercial additions like Cobenfy have yet to generate high-volume top-line offset.
Recommended Articles


