


Lumentum Holdings Inc Stock (LITE) Moved Down by 9.71% on Oct 12: A Full Analysis
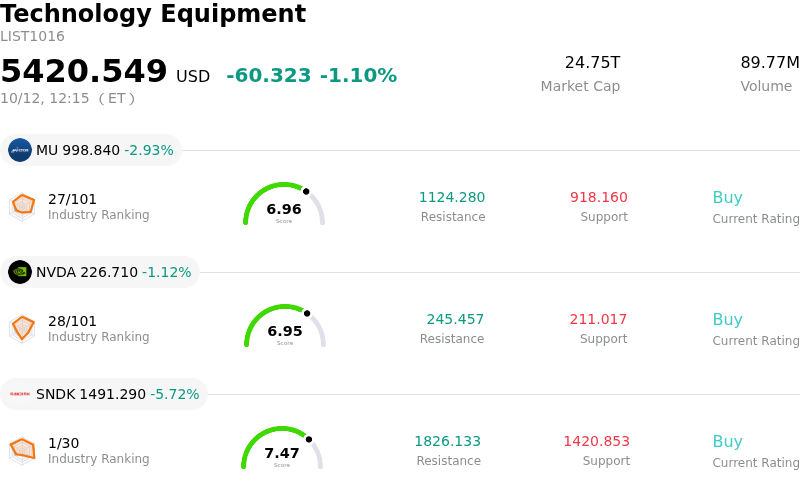
Lumentum Holdings Inc (LITE) moved down by 9.71%. The Technology Equipment sector is down by 1.10%. The company underperformed the industry. Top 3 stocks by turnover in the sector: Micron Technology Inc (MU) down 2.93%; NVIDIA Corp (NVDA) down 1.11%; SanDisk Corporation (SNDK) down 5.72%.
What is driving Lumentum Holdings Inc (LITE)’s stock price down today?
Lumentum Holdings experienced a sharp intraday pullback as sector-wide profit-taking swept through high-beta AI infrastructure and optical networking stocks. Following a substantial multi-month rally fueled by enthusiasm around optical connectivity in AI data centers, the stock encountered a sell-the-news dynamic surrounding high-profile industry events, such as the OCP Global Summit. Investors moved to lock in gains after heavily anticipated product demonstrations, while a cautious broader market tape for growth equities exacerbated downside volatility.
Sustained insider selling activity has further weighed on short-term market sentiment. Recent filings highlighting significant equity sales by executive leadership have raised flags among momentum-driven traders. Against a backdrop of rich valuation multiples relative to historical averages, these transactions have prompted market participants to reassess near-term risk-reward dynamics, balancing long-term technological tailwinds against potential valuation overextension.
From a fundamental standpoint, the drop contrasts with strong underlying demand signals. Executive commentary confirming sold-out capacity for key optical components through early 2029 underscores the durability of hyperscaler AI spending. However, management's warning of persistent supply shortfalls—where capacity will fail to meet a sizeable portion of customer demand over the coming years—highlights significant capacity bottlenecks. Investors remain cautious about near-term execution risks, including manufacturing ramp delays and potential supply chain constraints, even as the long-term structural narrative remains intact.
Technical Analysis of Lumentum Holdings Inc (LITE)
Technically, Lumentum Holdings Inc (LITE) shows a MACD (12,26,9) value of 5.929, indicating a buy signal. The RSI at 51.032 suggests neutral condition and the Williams %R at 55.774 suggests sell condition. Please monitor closely.
Media Coverage of Lumentum Holdings Inc (LITE)
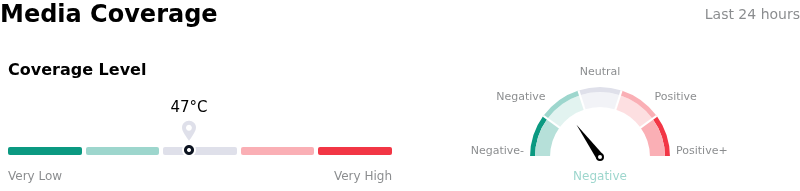
In terms of media coverage, Lumentum Holdings Inc (LITE) shows a coverage score of 47, indicating a moderate level of media attention. The overall market sentiment index is currently in bearish zone.
Fundamental Analysis of Lumentum Holdings Inc (LITE)
Lumentum Holdings Inc (LITE) is in the Technology Equipment industry. Its latest annual revenue is $3.01B, ranking 13 in the industry. The net profit is $-6.94B, ranking 59 in the industry. Company Profile
Over the past month, multiple analysts have rated the company as Buy, with an average price target of $1149.31, a high of $1500.00, and a low of $600.00.
More details about Lumentum Holdings Inc (LITE)
Company Specific Risks:
- Severe Supply and Manufacturing Capacity Bottlenecks: Management disclosed that optical components are sold out through 2029 and the company is unable to satisfy roughly 70% of customer demand for key products through next year, creating operational execution risks, extended fulfillment lead times, and potential market share loss if competitors scale faster.
- Substantial Executive Insider Share Liquidation: Recent SEC filings reveal notable insider selling, including Chief Financial Officer Wajid Ali selling over $25.7 million in stock (reducing his stake by 24.6%), alongside other executive Form 144 sales, signaling profit-taking concerns among top leadership at peak valuation levels.
- Extreme Stock Overextension and Technical Support Vulnerability: Following an extraordinary run-up to record high price levels above $1,100, the stock faces heightening intraday volatility and downside risk as analysts caution that failure to maintain technical support around $1,000 could trigger sharper institutional sell-offs.
- Significant Debt Load and Capital Structure Dilution Risk: SEC Form 10-K filings highlight $1.554 billion in aggregate outstanding debt, including convertible notes that have previously driven substantial debt extinguishment accounting losses and present ongoing refinancing and share dilution risks.
Recommended Articles


