


Ethereum (ETHUSD) Suddenly Goes down 1.09% on Oct 8: What's Driving This
Ethereum (ETHUSD) is down 1.09% at Oct 8 07:05(ET), now at $2543.92, with a 7-day down of 5.65%.
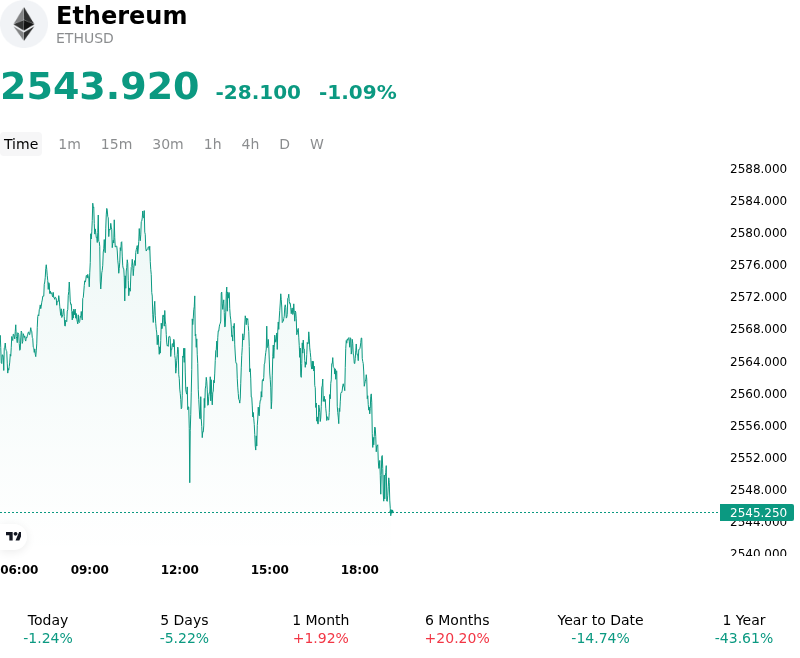
What is driving Ethereum (ETHUSD)’s stock price down today?
The downward pressure on Ethereum stems primarily from sustained institutional capital outflows across U.S. spot Ethereum exchange-traded funds. Recent multi-session net redemptions, highlighted by withdrawals from major institutional vehicles such as BlackRock's ETHA, have constrained spot market liquidity and removed a critical layer of structural bid support. This flow dynamics, where institutional capital has demonstrated a structural preference for Bitcoin over Ether, underscores a temporary contraction in institutional risk appetite for high-beta smart contract platforms. The persistent supply overhang generated by ETF redemptions has forced spot trading desks to absorb inventory, suppressing spot prices and triggering broader profit-taking across secondary execution venues.
Macroeconomic conditions have further reinforced sell-side pressure as broader financial markets adjust to tightening global liquidity dynamics. Recent Federal Reserve communications and hawkish policy expectations have elevated U.S. Treasury yields and supported dollar strength, altering the risk-reward profile for non-yielding digital assets. As real yields firm, institutional asset managers are recalibrating risk exposure and reallocating capital away from higher-volatility crypto assets toward defensive fixed-income instruments. The resulting tightening in macro risk sentiment has dampened dip-buying interest from institutional desks, leaving Ethereum vulnerable to localized downside repricing.
Market structure dynamics within cryptocurrency derivatives venues have magnified the intraday decline. As spot prices breached key technical support levels, concentrated long open interest in perpetual futures faced forced unwinding. A surge in long liquidations, accompanied by negative net taker volume and a sharp contraction in perpetual funding rates, accelerated sell-side momentum across major derivatives exchanges. Additionally, structural network dynamics continue to influence medium-term investor sentiment. The ongoing migration of transaction activity to Layer-2 scaling solutions has kept base-layer gas fees subdued, reducing ETH burn rates and resulting in modest net supply expansion. This shift has softened the immediate supply-scarcity narrative for Ether, leading institutional market participants to maintain a cautious stance until spot ETF flows normalize and global liquidity conditions stabilize.
Technical Analysis of Ethereum (ETHUSD)
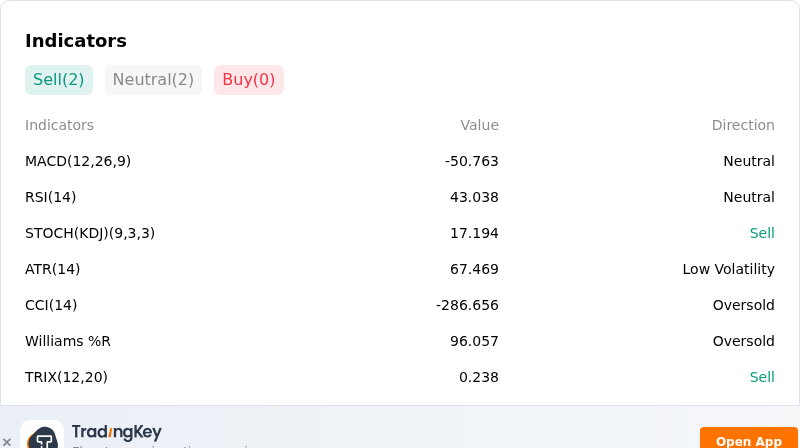
Technically, Ethereum (ETHUSD) shows a MACD (12,26,9) value of -50.763, indicating a neutral signal. The RSI at 43.038 suggests neutral condition and the Williams %R at 96.057 suggests oversold condition. Please monitor closely.
More details about Ethereum (ETHUSD)
Recent Events and Risks:
- Sustained Institutional Spot ETF Outflows: US spot Ethereum ETFs recorded seven consecutive sessions of net outflows pulling over $400 million from funds, including $201.9 million in a single day, eroding institutional buy-side demand and weighing heavily on intraday price action.
- Severe Derivatives Liquidation Cascades: A sharp price drop below $2,600 triggered over $200 million in ETH long liquidations over 24 hours, driving perpetual funding rates into negative territory and putting mega-whale positions with liquidation thresholds around $2,425 at immediate risk of further forced unwinds.
- Institutional Buyer Target Caps: Fading spot market appetite was exacerbated by disclosures from major corporate treasury buyers, such as BitMine, capping open-market ETH purchases upon reaching 5% of circulating supply, reducing expected structural bid support.
- Deteriorating On-Chain Demand and Staking Exits: The Coinbase Premium Index remaining persistently negative alongside a massive increase in the Ethereum validator exit queue to over 837,000 ETH highlights weak US institutional spot demand and potential supply overhang from unbonding stakers.
Recommended Articles


