


Bitcoin (BTCUSD) Is down 1.01% on Oct 8: Why It Happened
Bitcoin (BTCUSD) is down 1.01% at Oct 8 00:40(ET), now at $82556.01, with a 7-day down of 2.42%.
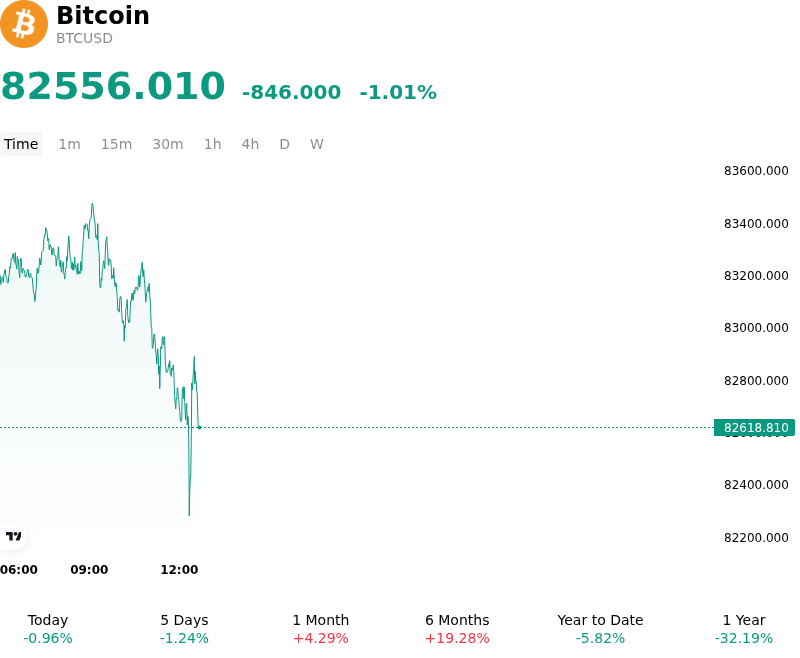
What is driving Bitcoin (BTCUSD)’s stock price down today?
Bitcoin experienced downside pressure as persistent macro headwinds and technical resistance near key upper-range levels dampened short-term risk appetite. Persistent strength in U.S. Treasury yields and a robust U.S. Dollar continued to weigh on non-yielding alternative assets, restricting broader macro liquidity. With institutional investors exercising caution ahead of critical economic data releases and central bank policy communications, risk assets across global markets faced temporary repricing.
The move lower was further compounded by shifts in capital flows across U.S. spot Bitcoin ETFs, where net daily redemptions signaled a temporary pause in institutional allocation momentum. As Bitcoin approached strong overhead supply barriers near its yearly opening level, the failure to clear resistance encouraged tactical profit-taking from short-term market participants. This pivot in spot liquidity cascaded into the derivatives market, triggering forced unwinds of leveraged long positions and expanding short-duration hedging activity across major trading venues.
Despite the intraday retreat, the underlying market structure reflects an orderly consolidation within a established multi-month range rather than a systemic trend reversal. Institutional market participants continue to monitor global monetary policy shifts, real yield trajectories, and upcoming inflation prints to assess macro liquidity conditions. Longer-term adoption dynamics, supported by evolving regulatory frameworks for digital asset custody and sustained institutional infrastructure development, remain key anchors for the broader market outlook.
Technical Analysis of Bitcoin (BTCUSD)
Technically, Bitcoin (BTCUSD) shows a MACD (12,26,9) value of -820.132, indicating a neutral signal. The RSI at 51.008 suggests neutral condition and the Williams %R at 88.402 suggests oversold condition. Please monitor closely.
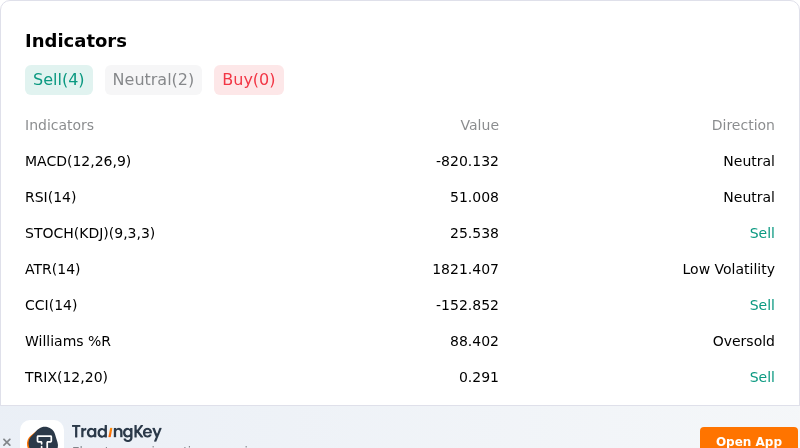
More details about Bitcoin (BTCUSD)
Recent Events and Risks:
- Leveraged Long Liquidation Cascade: Over $550 million in crypto long positions were forcibly liquidated as Bitcoin fell below $84,000, driven by a sharp unwinding of over-leveraged bullish bets and localized high-leverage shorting on derivatives venues that exacerbated downside volatility.
- Institutional Spot ETF Net Outflows: Institutional buying momentum showed clear signs of cooling as U.S. spot Bitcoin ETFs recorded nearly $90 million in daily net outflows, led by substantial redemptions in ARKB and FBTC that outweighed inflows into flagship funds.
- Macro Risk-Off and Yield Pressure: Escalating global energy supply fears—which pushed Brent crude oil above $100 per barrel—combined with 10-year U.S. Treasury yields rising above 5.3% and a strengthening U.S. dollar ahead of Federal Reserve minutes, have reduced risk appetite across digital asset markets.
- Technical Support Degradation: Bitcoin broke below the floor of its multi-week consolidation range around $83,000 to $84,000 after failing to clear resistance at $87,000, leaving price action vulnerable to a deeper move toward $80,000 if the 21-day moving average fails to maintain support.
Recommended Articles


