


XRP (XRPUSD) Fluctuated Significantly on Oct 8: Key Variables Behind the Move
XRP (XRPUSD) is down 1.40% at Oct 8 00:25(ET), now at $1.4024, with a 7-day down of 6.39%.
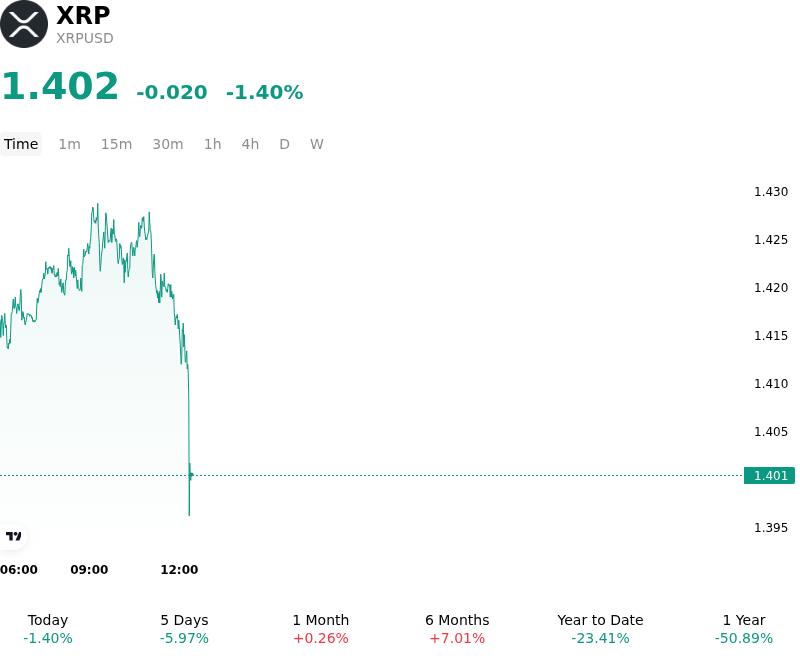
What is driving XRP (XRPUSD)’s stock price down today?
XRP experienced downside pressure during the trading session as a broader risk-off mood across digital assets and unfavorable macroeconomic headwinds drove profit-taking and leveraged long liquidations. Rising U.S. Treasury yields and a resilient U.S. dollar tightened global financial conditions, reducing investor appetite for non-yielding risk assets across crypto markets. As major benchmark assets experienced localized pullbacks, cascading long liquidations in perpetual futures venues spilled over into major altcoins, impairing short-term market liquidity and accelerating tactical exposure reductions.
From an asset-specific perspective, XRP faced technical resistance after failing to sustain a breakout above key overhead channels, leading short-term traders to unwind positions as momentum indicators turned bearish. On-chain and exchange balance data highlighted an uptick in exchange-ready token supply on centralized platforms, signaling elevated selling capacity relative to immediate spot demand. Although institutional interest in spot products and corporate treasury initiatives remain stable structural pillars, intraday liquidity flows were dominated by derivative position adjustments and caution surrounding upcoming macroeconomic data releases.
Despite the near-term retracement, broader institutional and utility fundamentals for the XRP ecosystem remain intact. Ongoing infrastructure upgrades to the XRP Ledger, expanding cross-border payment partnerships with Asian financial institutions, and the growth of real-world asset tokenization reflect steady long-term network adoption. Investors and institutional desks continue to monitor Fed policy expectations and global liquidity trends, treating current market softness as a tactical consolidation within a macro-driven market cycle.
Technical Analysis of XRP (XRPUSD)
Technically, XRP (XRPUSD) shows a MACD (12,26,9) value of -0.032, indicating a neutral signal. The RSI at 43.750 suggests neutral condition and the Williams %R at 95.181 suggests oversold condition. Please monitor closely.
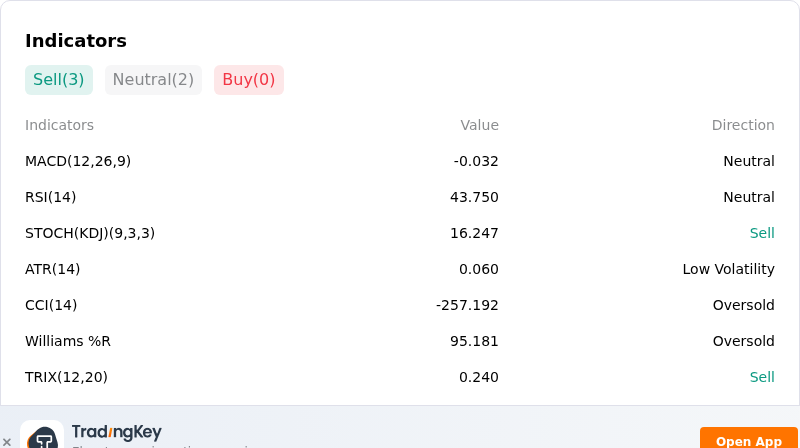
More details about XRP (XRPUSD)
Recent Events and Risks:
- Dramatically Slowing ETF Inflows and Catalyst Delays: Weekly institutional inflows into spot XRP funds have slowed to under $5 million down from over $75 million in previous sessions, while the expected Nasdaq listing of a major XRP treasury holding entity was delayed, removing immediate institutional buying tailwinds.
- Declining Derivatives Open Interest and Liquidation Vulnerability: Perpetual futures open interest for XRP contracted sharply from 3.8 billion to 3.4 billion XRP as retail demand waned, increasing the risk of accelerated forced sell-offs and long liquidation cascades if price breaks below the $1.40–$1.45 support floor.
- Whale Outflow Spikes and Supply Concentration: On-chain data shows 30-day whale outflows from Binance hitting a seven-month high of 1.38 billion XRP, while large holders control over 17% of circulating supply, leaving the token highly vulnerable to abrupt inter-exchange transfers or distribution moves by major holders.
- Technical Support Breakdown Amid Macro Risk-Off Pressure: XRP lost key technical support at $1.50 and dropped below its 20-day exponential moving average, underperforming the broader crypto market as rising Treasury yields and broader derivative liquidations drive elevated intraday downside volatility.
Recommended Articles


