


INNIO N V Ord Shs Stock (INIO) Closed Up by 12.49% on Oct 6: What Signal Does It Send?
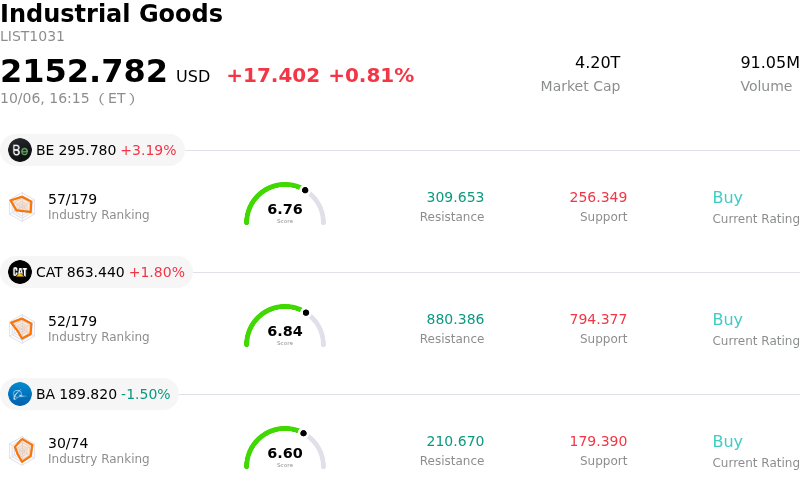
INNIO N V Ord Shs (INIO) closed up by 12.49%. The Industrial Goods sector is up by 0.81%. The company outperformed the industry. Top 3 stocks by turnover in the sector: Bloom Energy Corp (BE) up 3.19%; Caterpillar Inc (CAT) up 1.80%; Boeing Co (BA) down 1.50%.
What is driving INNIO N V Ord Shs (INIO)’s stock price up today?
INNIO N.V. demonstrated significant upside momentum alongside heightened intraday volatility, driven by strong sector tailwinds and accelerating institutional interest. The primary catalyst fueling market enthusiasm is the company's strategic positioning within distributed energy infrastructure, particularly to meet the surging electricity demands of artificial intelligence data centers and grid stabilization projects. As regional grid bottlenecks create operational constraints for technology expansion, decentralized power providers like INNIO have emerged as critical solution partners, sparking robust buying pressure.
The positive movement is further reinforced by a series of constructive business developments and fundamental milestones. The recently completed acquisition of Enerflex's aftermarket operations in the Asia-Pacific region expands INNIO's recurring revenue base and global service footprint. Additionally, large-scale commercial contract wins, including major firm orders for its signature engine systems, alongside facility expansion investments in the United States, have significantly enhanced multi-year revenue visibility. Credit rating upgrades from major rating agencies have also bolstered market confidence in the firm's financial policy and execution capability.
From a market mechanics perspective, the sharp upward move reflects momentum traders and institutional investors positioning ahead of the upcoming earnings release, breaking the stock out of its recent consolidation range. However, significant intraday volatility underscores an ongoing tug-of-war between bullish growth expectations and balance sheet risk considerations. While INNIO generates positive free cash flow and attractive underlying unit economics, its elevated debt obligations and interest expenses continue to weigh on net profitability. Investors should expect elevated price fluctuations to persist as the market balances strong top-line demand against debt leverage.
Technical Analysis of INNIO N V Ord Shs (INIO)
Technically, INNIO N V Ord Shs (INIO) shows a MACD (12,26,9) value of 0.765, indicating a neutral signal. The RSI at 53.912 suggests neutral condition and the Williams %R at 14.157 suggests overbought condition. Please monitor closely.
Fundamental Analysis of INNIO N V Ord Shs (INIO)
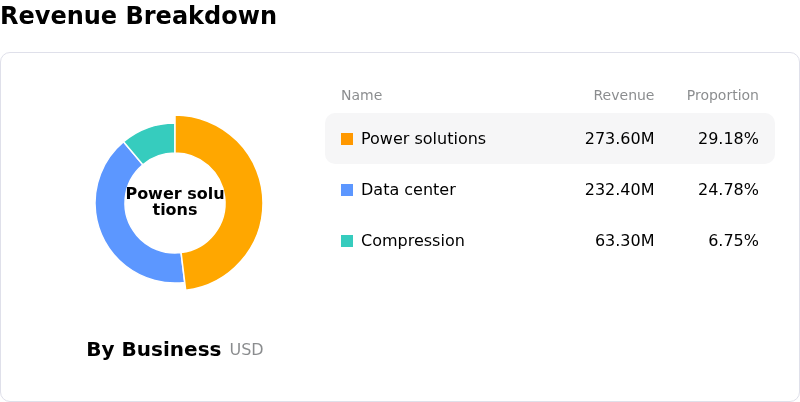
INNIO N V Ord Shs (INIO) is in the Industrial Goods industry. Its latest annual revenue is $2.64B, ranking 63 in the industry. The net profit is $144.30M, ranking 72 in the industry. Company Profile
Over the past month, multiple analysts have rated the company as Buy, with an average price target of $37.22, a high of $47.00, and a low of $27.00.
More details about INNIO N V Ord Shs (INIO)
Company Specific Risks:
- Intraday Overhead Supply and Profit-Taking: Recent trading sessions saw stock price spikes toward $20 quickly fade due to aggressive short-term profit-taking, creating strong technical resistance and heightening intraday downside volatility.
- Substantial Debt Service Burden: The company maintains a heavily leveraged balance sheet with over $2.6 billion in long-term debt against a small equity base of roughly $209 million, generating quarterly interest expenses above $50 million that push GAAP results into net losses.
- Operating Margin Compression: Profitability has deteriorated significantly as EBIT margins compressed to approximately 4.8% and net profit margins fell by over 30% year-over-year, exposing operational inefficiencies despite revenue gains.
- Class-Action Shareholder Legal Probes: Law firms, including Kessler Topaz Meltzer & Check and SBS Law, are actively soliciting investors for fraud and misrepresentation investigations following the company's IPO, creating ongoing legal liability and negative sentiment risks.
Recommended Articles


