


MACOM Technology Solutions Holdings Inc Stock (MTSI) Moved Up by 7.54% on Oct 6: A Full Analysis
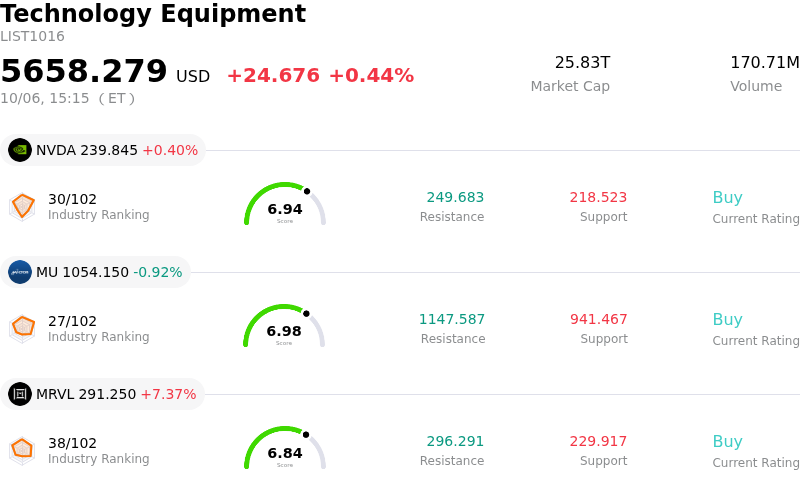
MACOM Technology Solutions Holdings Inc (MTSI) moved up by 7.54%. The Technology Equipment sector is up by 0.44%. The company outperformed the industry. Top 3 stocks by turnover in the sector: NVIDIA Corp (NVDA) up 0.40%; Micron Technology Inc (MU) down 0.92%; Marvell Technology Inc (MRVL) up 7.37%.
What is driving MACOM Technology Solutions Holdings Inc (MTSI)’s stock price up today?
MACOM Technology Solutions experienced strong upward price action driven primarily by positive analyst commentary, recent technological developments in artificial intelligence infrastructure, and accelerating momentum. A major catalyst behind the buying interest is Wall Street re-evaluating the company following a valuation contraction earlier in the year. Analyst upgrades, including a notable rating revision from BMO Capital, emphasized that the prior pullback brought the valuation to an attractive entry level given steady end-market demand across data centers, high-performance computing, and defense electronics.
Strategic product demonstrations have further bolstered investor sentiment. MACOM recently showcased its optical and high-speed connectivity portfolio at key industry events, including the European Conference on Optical Communication and European Microwave Week. The spotlight fell on its next-generation high-bandwidth optical chipset platform tailored for optical interconnects and hyperscale AI infrastructure. This directly connects the firm's growth trajectory to ongoing capital expenditure expansion in cloud data centers and AI computing networks.
From an operational perspective, institutional investors are responding favorably to the company's strong fundamental foundation. MACOM continues to demonstrate industry-leading gross and operating margins relative to analog and compound semiconductor peers, backed by a clean balance sheet featuring low debt leverage and strong interest coverage. These structural strengths reassure market participants that the firm can comfortably fund R&D and capacity expansion without capital structure stress.
Market sentiment and technical factors also played a pivotal role in driving intraday volatility. The stock extended a multi-day streak of positive performance as dip-buying activity picked up. Increased trading activity reflects strong participation from momentum traders and institutional funds seeking exposure to structural AI and defense spending cycles.
While premium valuation multiples require continuous execution, the combination of favorable Wall Street rating adjustments, direct exposure to AI interconnect infrastructure, and defense sector demand continues to generate robust buying pressure.
Technical Analysis of MACOM Technology Solutions Holdings Inc (MTSI)
Technically, MACOM Technology Solutions Holdings Inc (MTSI) shows a MACD (12,26,9) value of 16.896, indicating a buy signal. The RSI at 74.926 suggests buy condition and the Williams %R at 0.021 suggests overbought condition. Please monitor closely.
Fundamental Analysis of MACOM Technology Solutions Holdings Inc (MTSI)
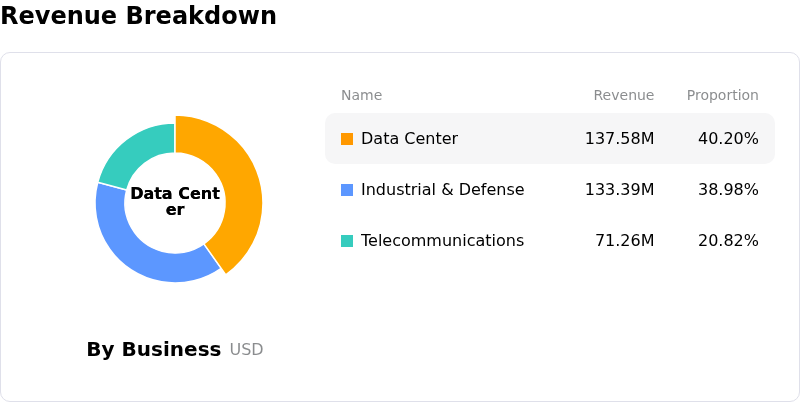
MACOM Technology Solutions Holdings Inc (MTSI) is in the Technology Equipment industry. Its latest annual revenue is $967.26M, ranking 44 in the industry. The net profit is $-54.21M, ranking 98 in the industry. Company Profile
Over the past month, multiple analysts have rated the company as Buy, with an average price target of $398.45, a high of $475.00, and a low of $300.00.
More details about MACOM Technology Solutions Holdings Inc (MTSI)
Company Specific Risks:
- Elevated Valuation Multiple Vulnerability: MACOM trades at a steep trailing P/E ratio exceeding 100x—significantly above the broader semiconductor sector median—leaving the stock exceptionally vulnerable to sharp multiple compression if upcoming guidance or growth rates fail to meet perfection-priced market expectations.
- Execution Risk on Next-Gen Optical Chipset Ramp: Heavy capital expenditures and R&D commitments directed toward its newly launched 3.2 Tbps optical chipset and compound semiconductor capacity require rapid customer adoption and flawless mass production to drive expected cash flows, exposing the business to operational risk if AI data center deployment cycles stall.
- Underperforming Operating Margins Relative to Peers: Despite recent revenue acceleration, the company's trailing operating margin of approximately 18.1% remains below the broader technology sector median of 21.7%, raising institutional concerns over cost discipline and potential margin compression as expansion costs escalate.
- Executive Insider Share Divestments: Recent SEC filings reveal insider selling by executive leadership—including the Chief Financial Officer and Senior Vice Presidents—reducing their direct equity holdings following the recent price surge, which signals cautious executive sentiment at current valuation tops.
Recommended Articles


