


Solana (SOLUSD) Volatility Intensified on Oct 6: What You Should Know
Solana (SOLUSD) is down 1.04% at Oct 6 02:10(ET), now at $118.4, with a 7-day up of 0.30%.
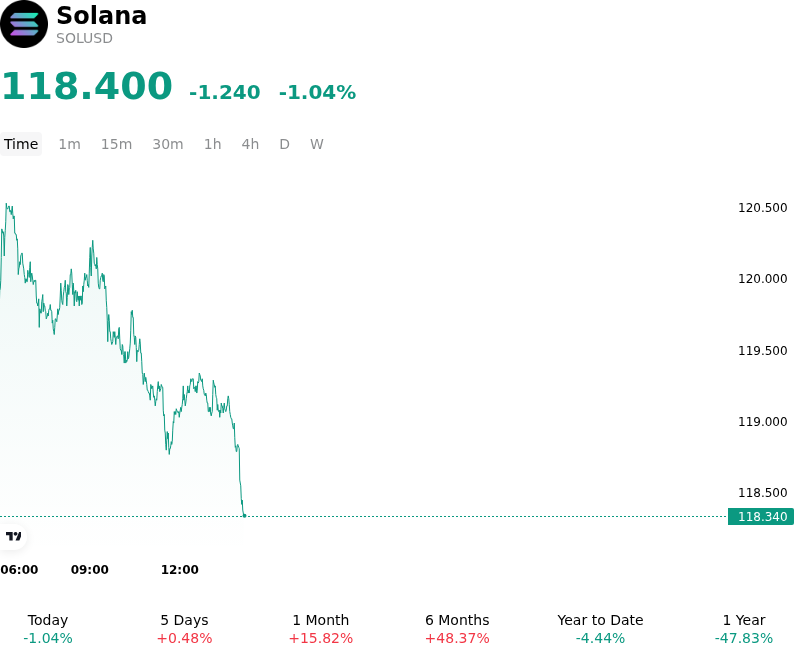
What is driving Solana (SOLUSD)’s stock price down today?
Solana encountered downward price pressure as spot buyers hesitated near established technical resistance around the $124 to $125 overhead zone, prompting short-term profit-taking and de-risking following recent upward momentum. The pullback reflects a temporary pause in capital inflows as market participants reassess risk exposure amid broader macroeconomic uncertainty, firm U.S. Treasury yields, and dollar stability ahead of key economic data releases. Without fresh macroeconomic catalysts or sustained spot institutional inflows to absorb selling pressure, trading activity shifted toward defensive positioning across major digital assets.
The decline was further exacerbated by a sharp retracement in Solana-native ecosystem tokens and speculative digital assets, which drained speculative liquidity and weakened retail risk sentiment across the network. Leverage in the derivatives market moderated as traders unspooled long positions that failed to confirm a decisive technical breakout above overhead levels. While on-chain metrics remain solid—driven by sustained decentralized exchange volume and expanding tokenized real-world asset deployments—the immediate price action underscores liquidity repricing and short-term capital rotation into benchmark assets or cash equivalents.
From an institutional perspective, the modest pullback represents a standard consolidation within a defined trading range rather than a structural deterioration of network fundamentals. Institutional investors continue to evaluate Solana’s long-term throughput capabilities, fee-capture efficiency, and expanding financial technology infrastructure against competing Layer-1 protocols. Key risks monitored by market strategists include persistent macro liquidity constraints, lingering leverage risks in perpetual futures, and potential shifts in broad-market risk appetite.
Technical Analysis of Solana (SOLUSD)
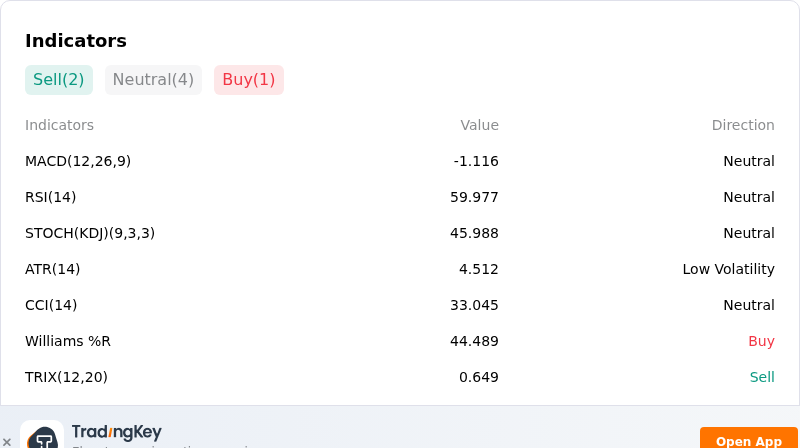
Technically, Solana (SOLUSD) shows a MACD (12,26,9) value of -1.116, indicating a neutral signal. The RSI at 59.977 suggests neutral condition and the Williams %R at 44.489 suggests buy condition. Please monitor closely.
More details about Solana (SOLUSD)
Recent Events and Risks:
- Perpetual Futures Over-Leverage and Liquidation Exposure: High open interest in Solana perpetual contracts remains heavily skewed toward long positions, leaving market structure vulnerable to rapid long-liquidation cascades and intraday volatility if spot prices fall below the critical $118–$120 support band.
- Spot ETF Outflows and Stalling Institutional Momentum: A shift to daily net outflows across U.S. spot Solana exchange-traded funds ended a prolonged inflow streak, dampening spot demand and signaling potential institutional fatigue at current resistance levels.
- On-Chain Whale Unstaking and Overhead Supply Pressure: On-chain monitoring highlights noticeable whale unstaking activity alongside multi-million-dollar SOL transfers directly to centralized exchange wallets, expanding liquid float and establishing overhead spot selling pressure.
- Validator Transition Vulnerabilities and Upgrade Risk: The upcoming Alpenglow consensus upgrade coincides with Jump Crypto terminating support for the widely used Frankendancer hybrid validator client, creating technical compliance risks and potential validator downtime if node operators delay migrating ahead of mainnet activation.
Recommended Articles


