


Shopify Inc Stock (SHOP) Opened Up by 6.65% on Oct 5: A Full Analysis
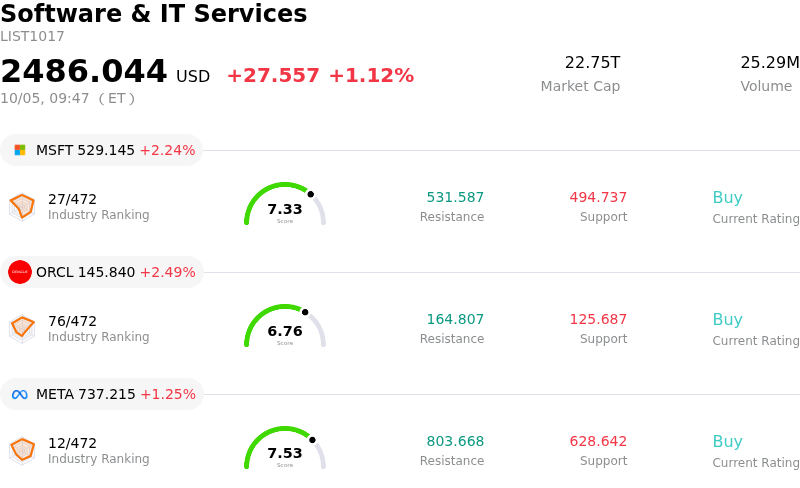
Shopify Inc (SHOP) opened up by 6.65%. The Software & IT Services sector is up by 1.12%. The company outperformed the industry. Top 3 stocks by turnover in the sector: Microsoft Corp (MSFT) up 2.64%; Oracle Corp (ORCL) up 2.49%; Meta Platforms Inc (META) up 1.67%.
What is driving Shopify Inc (SHOP)’s stock price up today?
Shopify experienced a strong upward rally driven by accelerating enthusiasm for its strategic expansion into artificial intelligence-powered commerce. Investors reacted positively to recent product developments and partnerships, most notably deeper integrations that enable browser-based AI agents and tools, such as Meta Platforms' Muse, to execute purchases directly through Shopify Checkout and Shop Pay. By establishing itself as the core transactional plumbing for agentic shopping, Shopify is positioned to capture transaction fees regardless of whether consumer entry points originate from traditional web storefronts or next-generation conversational AI interfaces.
The surge was further propelled by favorable macroeconomic conditions and broader risk-on sentiment across growth equities. Moderating labor market data reduced market expectations for Federal Reserve policy tightening, sparking a pullback in Treasury yields that specifically benefited high-valuation software and e-commerce leaders. As tech momentum returned, institutional investors leaned back into top-tier platform businesses, leveraging Shopify's dominant market share in direct-to-consumer infrastructure to adjust equity exposure.
Underpinning this momentum is sustained confidence in the company's financial discipline and core operational metrics. Strong growth in Gross Merchandise Volume, accelerating adoption of merchant payment solutions, and robust free cash flow generation have reinforced the view that Shopify can aggressively invest in AI-driven commerce without sacrificing operational profitability. While elevated valuation multiples leave the stock susceptible to intraday volatility, long-term investor sentiment remains supported by positive analyst commentary and optimistic expectations surrounding upcoming quarterly earnings.
Technical Analysis of Shopify Inc (SHOP)
Technically, Shopify Inc (SHOP) shows a MACD (12,26,9) value of 4.427, indicating a buy signal. The RSI at 68.033 suggests neutral condition and the Williams %R at 5.571 suggests overbought condition. Please monitor closely.
Fundamental Analysis of Shopify Inc (SHOP)
Shopify Inc (SHOP) is in the Software & IT Services industry. Its latest annual revenue is $11.56B, ranking 32 in the industry. The net profit is $1.23B, ranking 40 in the industry. Company Profile
Over the past month, multiple analysts have rated the company as Buy, with an average price target of $172.92, a high of $220.00, and a low of $120.00.
More details about Shopify Inc (SHOP)
Company Specific Risks:
- Escalating AI Infrastructure Costs Squeezing Operating Margins: Accelerated investments in large language models and platform-wide artificial intelligence tools like Sidekick are driving operational expenses higher, exerting downward pressure on profitability margins despite steady top-line expansion.
- Competitive Disintermediation Threat from Social Platforms: Institutional analysts highlight growing threats from tech giants, particularly Meta's deployment of autonomous AI business tools and direct SMB commerce capabilities, which risk disintermediating Shopify's core user interface and payment flows.
- Margin Contraction from Merchant Solutions Mix Shift: Revenue continues shifting heavily toward lower-margin Merchant Solutions—such as Shopify Payments—relative to higher-margin Subscription Solutions, dragging down aggregate gross margins and sparking institutional concerns over long-term operating leverage.
- Elevated Valuation Multiple Vulnerable to Growth Deceleration: Trading at a premium relative to sector peers, the stock remains acutely sensitive to any slowdown in Gross Merchandise Volume (GMV) or forward revenue targets, leaving minimal margin for error during market fluctuations.
Recommended Articles


