


Solana (SOLUSD) Is up 1.75% on Oct 4: What Are the Risk Factors?
Solana (SOLUSD) is up 1.75% at Oct 4 20:45(ET), now at $118.81, with a 7-day down of 2.38%.
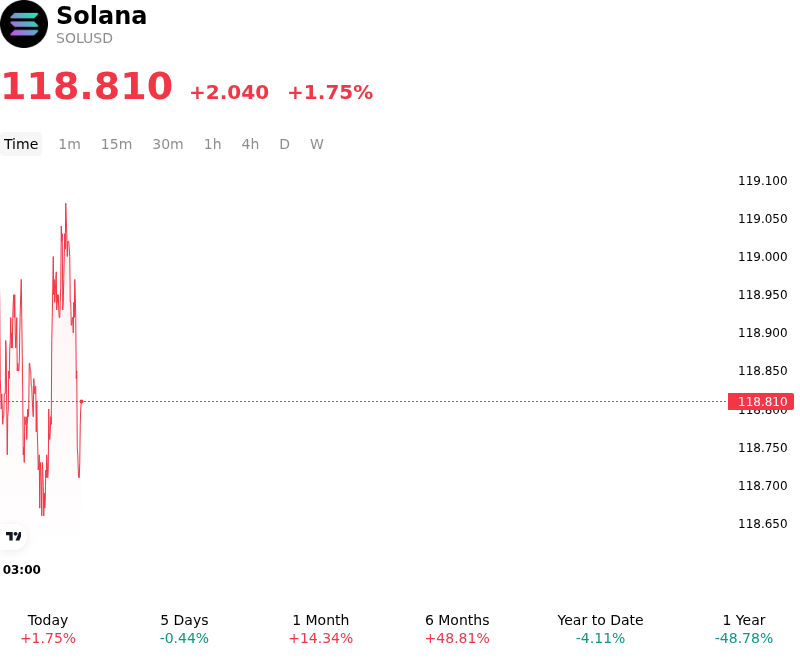
What is driving Solana (SOLUSD)’s stock price up today?
Capital flowed into Solana as sustained institutional demand through spot ETF allocations and steady fund inflows provided a firm liquidity tailwind. The persistent accumulation across spot investment vehicles and institutional accounts underscores growing structural confidence in Solana as a leading high-throughput smart contract platform. This steady buy-side demand has absorbed floating exchange supply, creating favorable upside pressure as institutional market participants increase exposure to networks demonstrating tangible adoption in real-world asset tokenization and enterprise payments.
Fundamentally, the upward movement is supported by robust on-chain momentum and network usage. Recent data highlights record quarterly transaction throughput, sustained recovery in total value locked across decentralized finance protocols, and all-time highs in circulating stablecoin liquidity. Announcements regarding cross-chain asset deployments and institutional tokenized fund integrations have further reinforced expectations for long-term network demand. As ecosystem activity accelerates, demand for native tokens to facilitate transaction settlement, decentralized liquidity provision, and network staking continues to strengthen.
In derivatives markets, open interest expanded alongside positive funding rates, reflecting constructive positioning and disciplined leverage building. The defense of key technical support levels encouraged momentum-driven buying and selective short covering, amplifying intraday upward price action. A broader rotation of capital within digital asset markets toward proven Layer-1 ecosystems, combined with supportive global liquidity conditions, provided additional tailwinds for risk-on appetite.
While the near-term market structure remains constructive, institutional investors continue to evaluate key macro and micro risks. Shifts in Federal Reserve monetary policy, global yield dynamics, and potential fluctuations in ETF net inflows remain critical macro drivers. At the network level, market participants are monitoring scheduled ecosystem token unlocks and the execution of upcoming protocol upgrades designed to optimize transaction finality and consensus efficiency to ensure network scaling keeps pace with growing institutional integration.
Technical Analysis of Solana (SOLUSD)
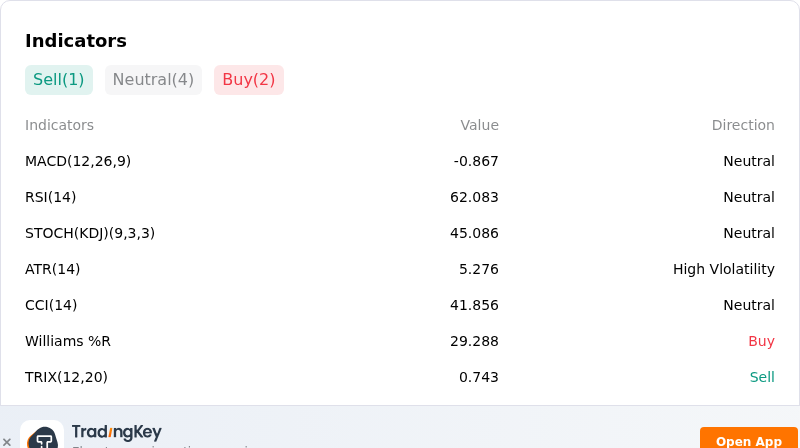
Technically, Solana (SOLUSD) shows a MACD (12,26,9) value of -0.867, indicating a neutral signal. The RSI at 62.083 suggests neutral condition and the Williams %R at 29.288 suggests buy condition. Please monitor closely.
More details about Solana (SOLUSD)
Recent Events and Risks:
- Whale Unstaking and Exchange Transfers: On-chain tracking highlights substantial whale wallet unstaking activity and multi-million dollar SOL transfers directly to centralized exchanges, increasing liquid circulating float and generating overhead spot sell pressure.
- Derivatives Long Over-Leverage and Liquidation Vulnerability: Open interest in Solana perpetual futures remains heavily skewed toward long positions around the $118–$120 price area, leaving market structure vulnerable to rapid long liquidation cascades if key technical support collapses.
- Mainnet Upgrade Timeline Uncertainty: Speculative momentum cooled after core developer updates confirmed that the performance-enhancing Alpenglow upgrade remains in testnet testing without a finalized mainnet deployment date, triggering sell-the-fact profit-taking.
- Spot ETF Outflow Signals and High-Beta Macro Risk: A shift to net daily outflows in U.S. spot Solana ETFs ended a sustained inflow trend, leaving the high-beta asset exposed to broader market drag from rising U.S. Treasury yields and U.S. dollar strength.
Recommended Articles


