


BNB (BNBUSD) Fluctuated Significantly on Oct 3: Key Variables Behind the Move
BNB (BNBUSD) is up 1.01% at Oct 3 08:50(ET), now at $769.8, with a 7-day up of 0.31%.
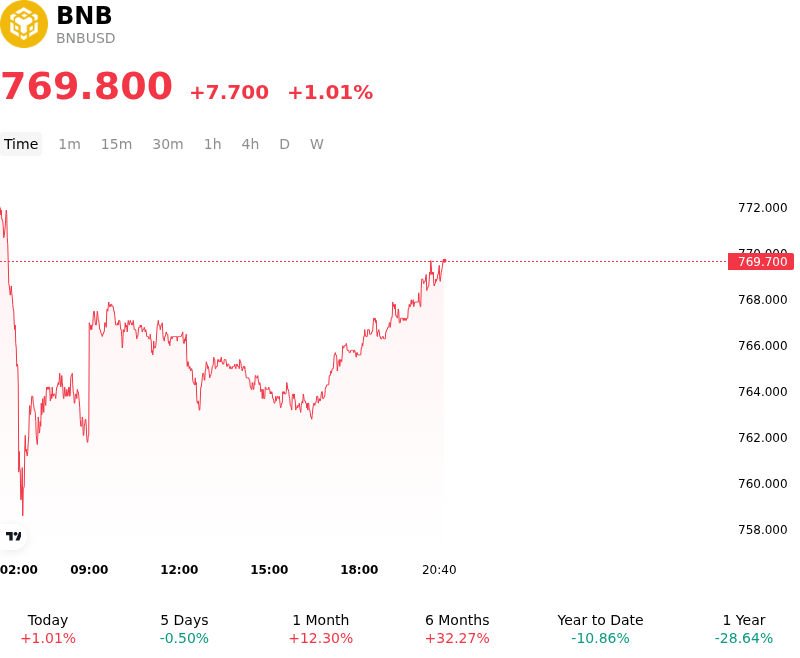
What is driving BNB (BNBUSD)’s stock price up today?
Capital flowed into BNB as improving global liquidity conditions and stabilizing macroeconomic sentiment encouraged risk asset accumulation across major digital assets. Softer U.S. economic data bolstered expectations of an accommodative stance from the Federal Reserve, helping ease pressure on Treasury yields and moderating U.S. dollar strength. Within the digital asset space, sustained stablecoin liquidity across the Binance ecosystem provided strong baseline trading support, facilitating spot accumulation and improving broader market participation.
Asset-specific fundamentals provided additional structural tailwinds, driven by market anticipation surrounding the upcoming 37th quarterly BNB token burn. Investors routinely position ahead of these scheduled auto-burn mechanisms, which systematically reduce circulating supply and reinforce the token's long-term deflationary framework. Furthermore, ongoing development milestones across the BNB Chain ecosystem—including infrastructure preparation for protocol upgrades and expanding wallet integrations across multi-chain platforms—further strengthened investor confidence in network utility and long-term adoption expectations.
From a market structure perspective, BNB demonstrated technical resilience by holding firm above key moving average support levels. This price stability encouraged systematic buying and modest leverage re-positioning within derivatives markets, where futures open interest remained healthy as traders pushed toward overhead resistance. While supply contraction dynamics and network utility continue to underpin the broader bullish structure, institutional market participants continue to monitor macro liquidity trends, potential regulatory developments impacting centralized exchange platforms, and sudden leverage liquidations that could introduce short-term volatility.
Technical Analysis of BNB (BNBUSD)
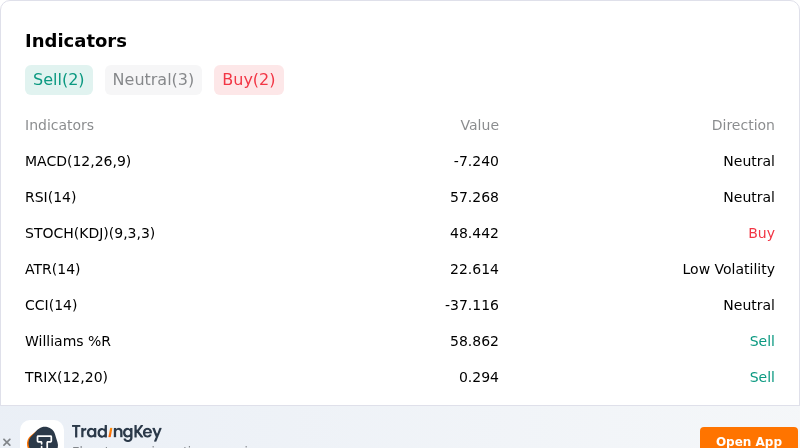
Technically, BNB (BNBUSD) shows a MACD (12,26,9) value of -7.240, indicating a neutral signal. The RSI at 57.268 suggests neutral condition and the Williams %R at 58.862 suggests sell condition. Please monitor closely.
More details about BNB (BNBUSD)
Recent Events and Risks:
- European Union MiCA Regulatory Scrutiny: European Securities and Markets Authority (ESMA) and regional regulators opened inquiries into Binance's use of "reverse solicitation" legal exemptions to serve EU customers after its MiCA license application was rejected, heightening the immediate risk of regulatory enforcement, fines, or operational restrictions.
- Overhead Resistance and Technical Breakdown Risks: BNB faces persistent sell-side pressure near the critical $800 resistance ceiling, with momentum indicators turning bearish and raising intraday risk of a breakdown below the $746 support level toward the $718–$720 moving average cluster.
- Elevated Derivatives Leverage and Liquidation Clusters: BNB futures open interest remains elevated above $1.3 billion, leaving market structure vulnerable to sudden leverage unwinds and volatility spikes as short- and long-liquidation clusters aggregate around $794–$800 and key downside triggers.
- Macro Yield Pressures and On-Chain Liquidity Cooling: Multi-decade high Treasury yields and persistent high interest rates continue to dampen broader risk-on crypto flows, while cooling decentralized exchange (DEX) volume on the BNB Smart Chain reduces organic buy-side market depth during intraday pullbacks.
Recommended Articles


