


Solana (SOLUSD) Volatility Intensified on Oct 2: What You Should Know
Solana (SOLUSD) is up 1.05% at Oct 2 21:55(ET), now at $118.37, with a 7-day down of 2.58%.
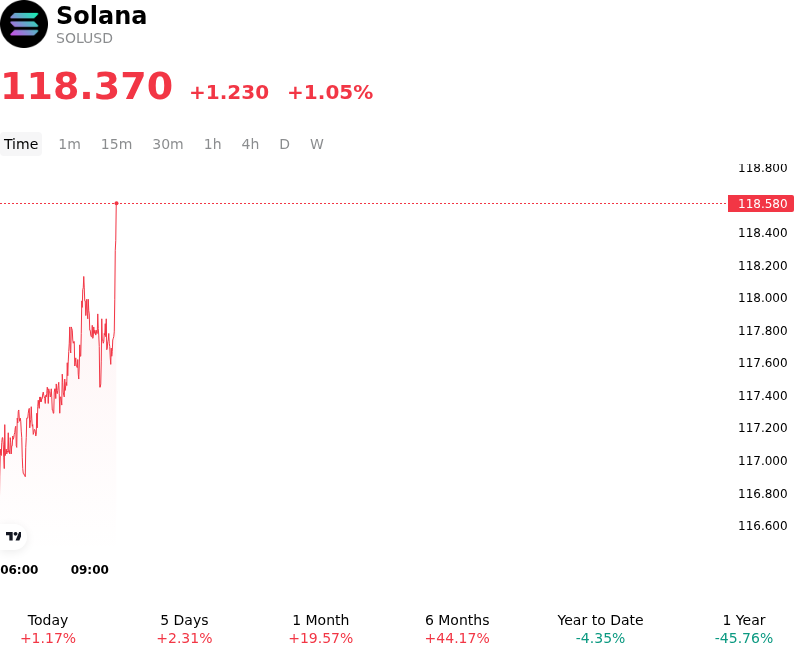
What is driving Solana (SOLUSD)’s stock price up today?
Solana advanced as persistent institutional capital inflows through regulated spot exchange-traded funds provided a solid foundation for price discovery. Sustained demand for spot ETF products, particularly those integrating native staking yields, has effectively absorbed secondary market supply and constrained liquid circulating float. Accommodative global liquidity conditions, driven by stabilizing U.S. Treasury yields and evolving monetary policy expectations, further enhanced broad market risk appetite, prompting institutional desks to reallocate capital into premier Layer-1 ecosystems.
Fundamental strength across the Solana ecosystem reinforced investor adoption expectations and expanded real-world utility. On-chain data indicates elevated trading volumes across decentralized exchanges, alongside rapid expansion in stablecoin issuer integration and tokenized real-world asset initiatives. Institutional sentiment was further buoyed by technical progress on the Alpenglow network upgrade, designed to substantially reduce transaction finality times. These infrastructure enhancements bolster Solana's competitive positioning in institutional settlement and high-frequency decentralized applications.
Market structure and derivatives dynamics accelerated the upward momentum. As spot price action maintained firm technical support, perpetual swap markets exhibited positive funding rates and an expansion in open interest, signaling constructive leverage positioning. Short positions encountered localized liquidations, providing additional mechanical buying pressure. The absence of extreme overleveraging indicates that the advance was predominantly driven by spot-led institutional accumulation rather than purely speculative leverage.
Investors continue to track macro liquidity indicators and potential regulatory developments governing digital asset staking framework compliance. While network upgrade execution risks and broader altcoin market volatility remain active monitoring points, the combination of disciplined institutional ETF demand and robust on-chain economic activity underscores a strengthening structural investment thesis for the platform entering the fourth quarter.
Technical Analysis of Solana (SOLUSD)
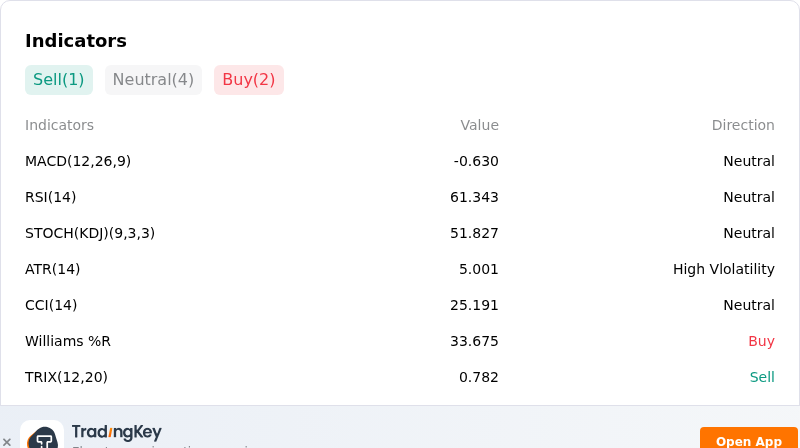
Technically, Solana (SOLUSD) shows a MACD (12,26,9) value of -0.630, indicating a neutral signal. The RSI at 61.343 suggests neutral condition and the Williams %R at 33.675 suggests buy condition. Please monitor closely.
More details about Solana (SOLUSD)
Recent Events and Risks:
- Large Whale Unstaking and Exchange Inflows: On-chain data indicates substantial whale activity, including large wallets unstaking significant SOL holdings and transferring millions of dollars worth of tokens to centralized exchanges, heightening immediate sell-side supply pressure.
- Derivatives Leverage and Liquidation Cascade Vulnerability: Open interest across Solana futures remains heavily skewed toward long positions near key support levels, creating a dense liquidation cluster that risks triggering sharp sell-offs if price breaks below immediate technical pivots.
- Declining On-Chain Activity and Ecosystem DEX Volumes: On-chain metrics highlight a contraction in network usage, driven by diminishing speculative retail trading and falling decentralized exchange volumes, weakening organic fee burns and demand for SOL.
- High-Beta Exposure to Macro Risk-Off Pressures: Solana continues to exhibit high beta relative to the broader crypto market, making it particularly vulnerable to intraday drawdowns triggered by rising Treasury yields, macroeconomic uncertainty, and broader digital asset market weakness.
Recommended Articles


