


Micro Silver (XAGUSD-M) Is down 2.11% on Sep 28: Why It Happened
Micro Silver (XAGUSD-M) is down 2.11% at Sep 28 21:05(ET), now at $62.928, with a 7-day down of 4.53%.
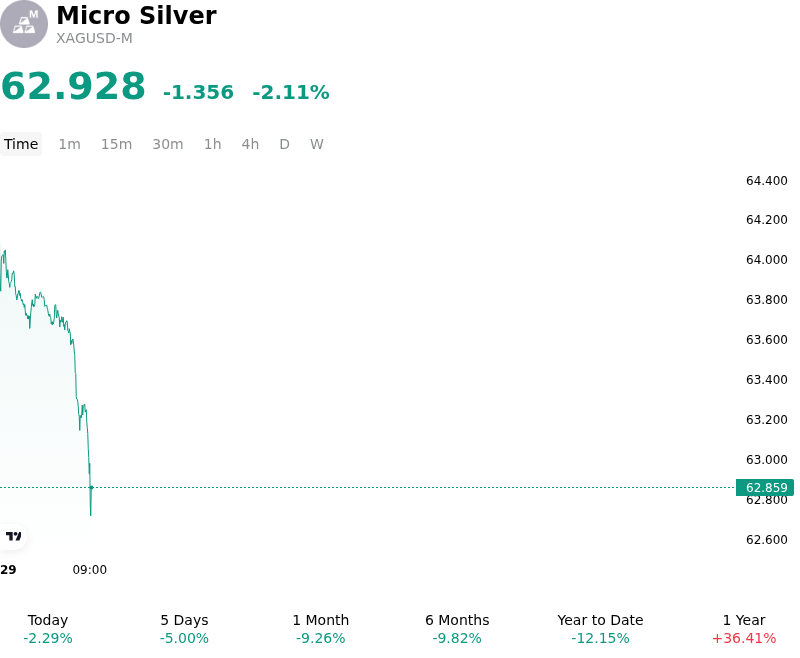
What is driving Micro Silver (XAGUSD-M)’s stock price down today?
The pullback in silver spot and futures markets reflects an intensifying macroeconomic repricing driven by hawkish Federal Reserve policy expectations and rising opportunity costs for non-yielding assets. Persistent underlying inflation concerns and resilient US economic indicators have reinforced expectations that central bank policy rates will remain higher for longer, driving benchmark US Treasury yields toward multi-year highs. The resulting surge in real yields, combined with sustained strength in the US dollar, generated significant headwinds for precious metals by suppressing financial investor demand and raising purchase costs for international buyers.
Beyond monetary headwinds, silver's dual role as an industrial commodity exposed it to recalibrated physical demand expectations. While structural deficits persist across the broader physical market, sentiment has been tempered by reports of reduced silver usage in solar photovoltaic manufacturing, where elevated prices have incentivized thrifting and cell efficiency adjustments among panel producers. Additionally, broader moderation in global industrial production indicators has trimmed short-term consumption growth expectations across electronics and manufacturing applications, easing immediate physical market tightness.
Capital flows and paper market dynamics further amplified downside price action. Institutional and speculative long positioning on futures exchanges, which had accumulated in previous sessions, encountered significant liquidation pressure as key technical support levels gave way. With short interest remaining comparatively thin, the market lacked a natural short-covering cushion, leaving price action vulnerable to momentum-driven institutional selling. Consequently, the unwinding of leveraged long positions coupled with broader risk-off adjustments across precious and industrial metals drove the decline.
Technical Analysis of Micro Silver (XAGUSD-M)
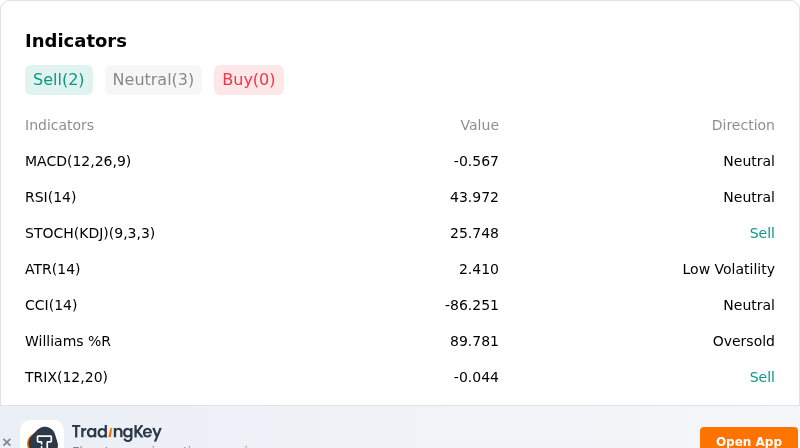
Technically, Micro Silver (XAGUSD-M) shows a MACD (12,26,9) value of -0.567, indicating a neutral signal. The RSI at 43.972 suggests neutral condition and the Williams %R at 89.781 suggests oversold condition. Please monitor closely.
More details about Micro Silver (XAGUSD-M)
Recent Events and Risks:
- Hawkish Monetary Expectations and Yield Spikes: Hawkish signals from Federal Reserve officials reinforcing a higher-for-longer rate outlook have pushed U.S. Treasury yields to multi-year highs and strengthened the U.S. Dollar. The resulting rise in real yields increases the opportunity cost of holding non-yielding precious metals, sparking persistent selling pressure on XAGUSD.
- Weakening Industrial End-Use Demand: Restrictive global monetary conditions are dampening manufacturing Purchasing Managers' Indices, raising concerns over near-term industrial consumption. Softening demand sentiment across silver-intensive sectors—such as solar photovoltaic manufacturing, electronics, and automotive components—is weakening physical market support.
- Unwinding of Geopolitical Inflation Premiums: Stabilization in global energy markets and diplomatic dialogues have moderated Middle Eastern supply concerns and reduced energy-driven inflation expectations. This easing of geopolitical risk premiums has diminished immediate institutional hedging demand for silver.
- Technical Breakdown and Position Liquidation: Failure to clear key overhead resistance near $68.00 followed by a drop toward critical support around $62.30 has triggered automated stop-loss liquidations and momentum unspooling, leaving the market exposed to accelerated intraday downside volatility.
Recommended Articles


