


Solana (SOLUSD) Volatility Intensified on Sep 26: What You Should Know
Solana (SOLUSD) is up 4.90% at Sep 26 20:35(ET), now at $121.51, with a 7-day up of 10.34%.
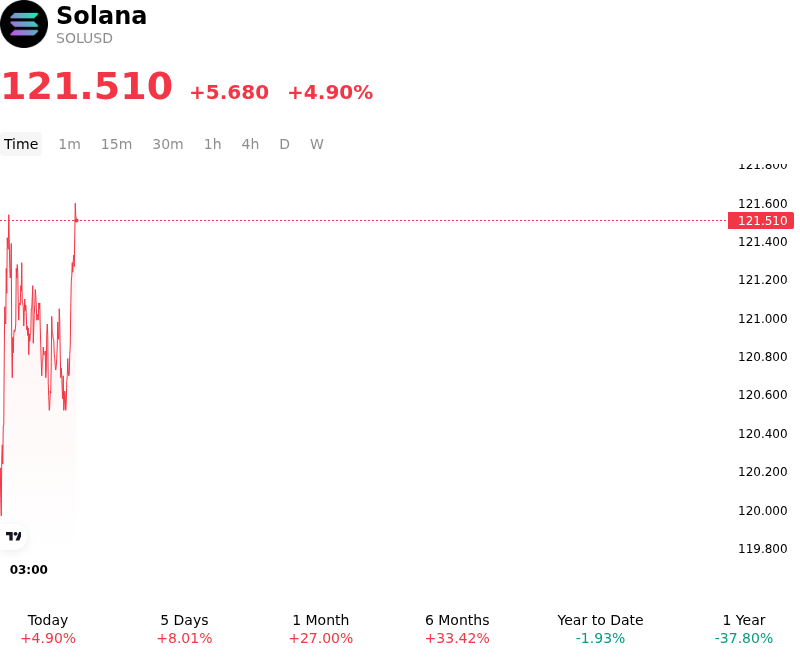
What is driving Solana (SOLUSD)’s stock price up today?
Capital rotated into Solana as a confluence of institutional demand, protocol upgrade momentum, and derivative-driven buy pressure propelled price action higher. Investor sentiment was sharply bolstered by anticipation surrounding the mainnet deployment of the Alpenglow network upgrade, designed to dramatically reduce transaction finality to sub-second levels and improve network fault tolerance. This fundamental technical catalyst provided a clear operational tailwind, encouraging fundamental investors and systematic funds to build long positions ahead of the network milestone.
Institutional participation through exchange-traded products provided structural buy-side support. Persistent capital inflows into spot and staking Solana ETF vehicles demonstrated sustained institutional appetite, continuing an extended multi-week streak of net positive allocations. Furthermore, corporate treasury allocations into SOL and expanding chain leadership in tokenized real-world assets reinforced the institutional thesis for the network, helping absorb spot liquidity and tightening exchange-held supply.
Derivatives market mechanics played a critical role in accelerating intraday upside momentum. As price action broke through key technical resistance levels, bearish positioning was caught off balance, triggering a wave of forced short liquidations across major perpetual swap markets. The resulting short squeeze drove futures open interest higher and catalyzed secondary momentum buying, while decentralized exchange aggregators registered elevated spot trading volume across the ecosystem.
While the immediate advance reflects robust structural inflows and improving network adoption, institutional investors continue to monitor global liquidity conditions and central bank monetary policy shifts. Sustained outperformance will depend on seamless technical execution of protocol upgrades, stable exchange liquidity, and the ongoing expansion of decentralized application activity relative to broader digital asset market volatility.
Technical Analysis of Solana (SOLUSD)
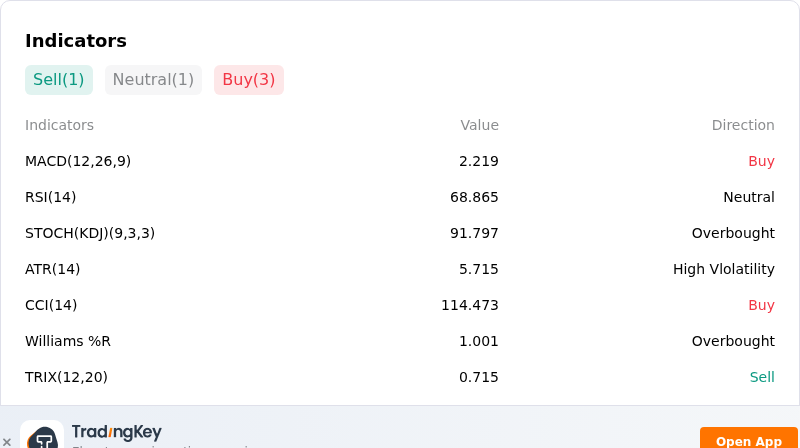
Technically, Solana (SOLUSD) shows a MACD (12,26,9) value of 2.219, indicating a buy signal. The RSI at 68.865 suggests neutral condition and the Williams %R at 1.001 suggests overbought condition. Please monitor closely.
More details about Solana (SOLUSD)
Recent Events and Risks:
- Heavy Overhead Resistance and Momentum Deceleration: After testing the $119–$120 resistance zone, SOL's intraday momentum has shown visible deceleration across shorter timeframes, leaving price vulnerable to short-term profit-taking and mean-reversion if support near $116 breaks.
- Alpenglow Mainnet Upgrade Execution and Validator Activation Risks: Ahead of the scheduled September 28 Alpenglow consensus upgrade, developer Anza noted the launch date remains tentative pending a 95% validator adoption threshold, exposing the market to "sell-the-news" positioning and technical execution hazards.
- Drastic Slowdown in Spot ETF Inflows and Quarter-End Rebalancing: Institutional demand via U.S. spot Solana ETFs has experienced a sharp deceleration, dropping from peak weekly inflows of over $150 million down to approximately $6 million, leaving market structure reliant on speculative spot volume during quarter-end portfolio rebalancing.
- Crowded Long Derivatives Positioning and Liquidation Vulnerability: Derivatives metrics reflect a heavily long-skewed open interest profile alongside elevated sentiment (Fear & Greed Index at 71), exposing leveraged traders to sharp liquidation cascades if broader market weakness triggers a pull back below major support levels.
Recommended Articles


