


Solana (SOLUSD) Is up 1.03% on Sep 24: Why It Happened
Solana (SOLUSD) is up 1.03% at Sep 24 20:05(ET), now at $114.2, with a 7-day up of 13.87%.
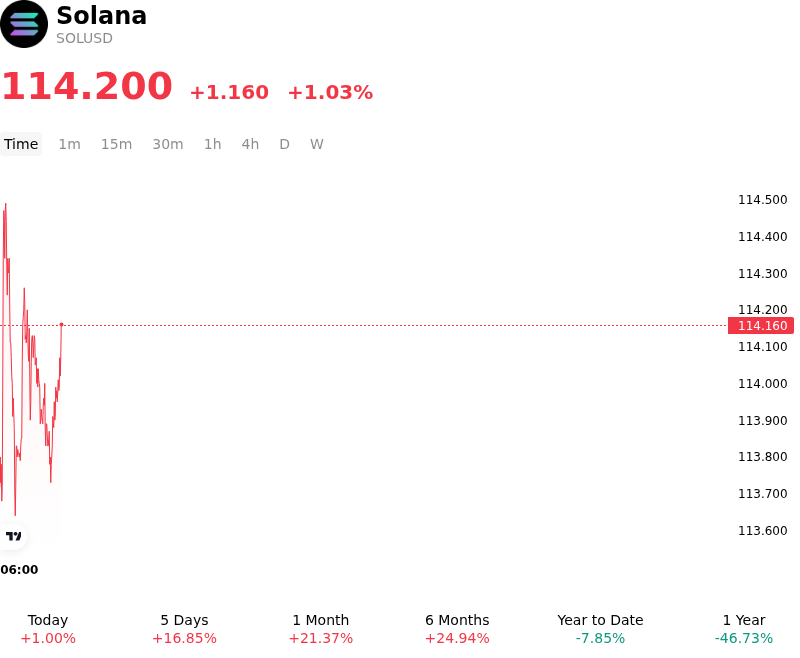
What is driving Solana (SOLUSD)’s stock price up today?
The upward movement in Solana reflects a combination of macro liquidity resilience and accelerating institutional capital inflows into the ecosystem. Despite recent monetary policy tightening by the Federal Reserve, digital asset markets have demonstrated structural absorption, allowing risk capital to rotate back into high-throughput Layer-1 platforms. Institutional demand for regulated yield-bearing products provided a primary bid for the asset, underlined by substantial net inflows into exchange-listed Solana staking vehicles. Furthermore, corporate treasury accumulation strategies gathered momentum, highlighted by equity-funded capital raises from public companies dedicated explicitly to acquiring and holding native tokens as strategic balance sheet assets.
On-chain fundamentals and upcoming technical milestones further reinforced investor sentiment. Transaction activity across Solana's decentralized exchange network reached historic volume levels, driven by sustained liquidity in automated market makers and high-frequency trading activity. This robust network throughput has highlighted the protocol's growing share of spot liquidity relative to competing smart contract platforms. Concurrently, market participants expanded risk exposure ahead of major network protocol overhauls, including the impending deployment of performance upgrades aimed at significantly reducing transaction latency. These technical advancements have strengthened the long-term adoption thesis among institutional allocators seeking scalable decentralized infrastructure.
From a market structure perspective, derivatives positioning supported the upside momentum as systematic traders and market makers adjusted to improving technical indicators. A shift in funding rates toward positive territory alongside expanding open interest indicates steady directional accumulation rather than leveraged retail speculation. While macro headwinds—including elevated Treasury yields and persistent policy uncertainty—remain active risk factors, the convergence of sustained exchange-traded product inflows, balance sheet adoption, and robust on-chain throughput continues to anchor institutional bid depth for Solana.
Technical Analysis of Solana (SOLUSD)
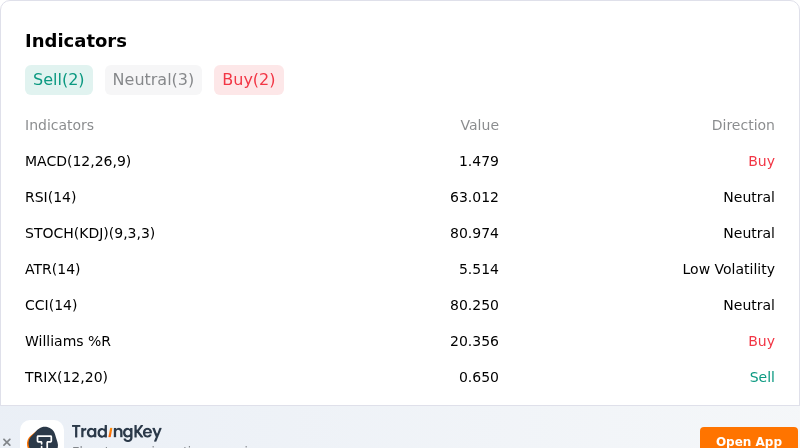
Technically, Solana (SOLUSD) shows a MACD (12,26,9) value of 1.479, indicating a buy signal. The RSI at 63.012 suggests neutral condition and the Williams %R at 20.356 suggests buy condition. Please monitor closely.
More details about Solana (SOLUSD)
Recent Events and Risks:
- Overhead Resistance Reversal and Long Liquidation Exposure: After climbing toward $117–$119 on a brief $18 million short squeeze, SOL faced heavy profit-taking that pulled prices back down to $113–$114. With open interest elevated near $7.3 billion and thin liquidity depth relative to other major assets, failure to clear the heavy $120 resistance leaves leverage positions vulnerable to rapid liquidation cascades if support at $110 fails.
- Elevated Implied Volatility and Put-Options Positioning: Options market metrics show Solana's short-term implied volatility widening significantly over Bitcoin and Ether to exceed 50%. Recent options flow indicates a notable shift in risk reversals toward puts, signaling that traders are actively hedging against near-term downside shocks.
- Regulatory Oversight Friction on Staking and Custody: Heightened legal scrutiny is impacting institutional sentiment following the SEC's submission of new crypto custody rules to the White House OMB and the CFTC pushing updated derivatives oversight after the Senate failed to pass the CLARITY Act. These developments increase compliance risk for institutional custodians and yield-bearing Solana products.
- Protocol Upgrade Execution Risk and Lockup Friction: Ahead of the major "Alpenglow" network upgrade scheduled for late September, market participants are expressing caution over potential execution risks and validator consensus disruptions. Short-term liquidity risks are amplified by unstaking lockup periods, which prevent delegators from reacting immediately during periods of high intraday price volatility.
Recommended Articles


