


Lam Research Corp Stock (LRCX) Moved Down by 3.29% on Sep 23: What Signal Does It Send?
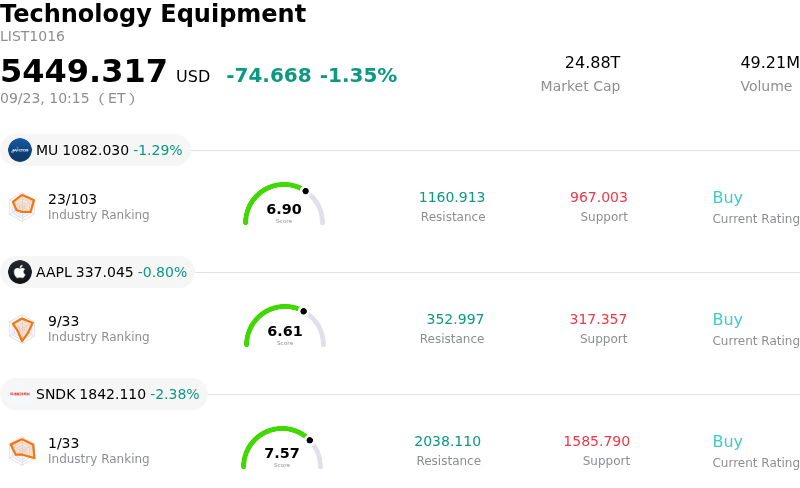
Lam Research Corp (LRCX) moved down by 3.29%. The Technology Equipment sector is down by 1.35%. The company underperformed the industry. Top 3 stocks by turnover in the sector: Micron Technology Inc (MU) down 1.29%; Apple Inc (AAPL) down 0.62%; SanDisk Corporation (SNDK) down 2.39%.
What is driving Lam Research Corp (LRCX)’s stock price down today?
The downward pressure on Lam Research shares stems primarily from a combination of ex-dividend trading adjustments and profit-taking across the semiconductor equipment sector. The company traded ex-dividend following a recent increase to its quarterly payout, which naturally results in a mechanical downward adjustment to the share price on the ex-dividend date. This structural headwind was compounded by short-term profit-taking from institutional and retail investors following a sharp multi-day rebound in chip equipment equities.
Beyond the ex-dividend effect, sector-specific operational realities continue to influence short-term market sentiment. Although long-term demand for artificial intelligence infrastructure, high-bandwidth memory, and advanced packaging remains strong, tier-1 semiconductor foundries face ongoing physical cleanroom capacity constraints. These spatial limitations slow the rate at which newly delivered wafer fabrication equipment can be installed and converted into recognized revenue, prompting selective target price recalibrations from Wall Street analysts. Additionally, elevated valuation multiples relative to historical medians leave the stock sensitive to intraday profit-taking during broader technology pullbacks.
Market sentiment has also been mildly constrained by regulatory disclosures pointing to persistent executive stock sales over recent months. Despite these short-term headwinds, Lam Research maintains strong foundational positioning in critical etch and deposition processes, backed by resilient margins, robust free cash flow, and healthy balance sheet liquidity. Investors continue to weigh near-term operational bottlenecks against structural multi-year growth trends in semiconductor manufacturing capital expenditures.
Technical Analysis of Lam Research Corp (LRCX)
Technically, Lam Research Corp (LRCX) shows a MACD (12,26,9) value of 3.880, indicating a neutral signal. The RSI at 50.173 suggests neutral condition and the Williams %R at 38.617 suggests buy condition. Please monitor closely.
Media Coverage of Lam Research Corp (LRCX)
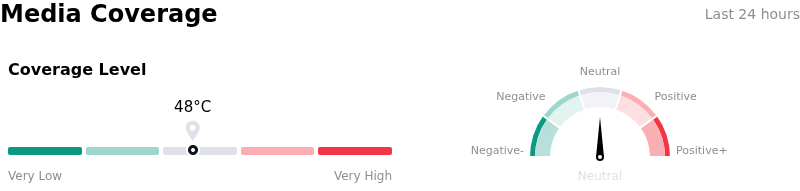
In terms of media coverage, Lam Research Corp (LRCX) shows a coverage score of 48, indicating a moderate level of media attention. The overall market sentiment index is currently in neutral zone.
Fundamental Analysis of Lam Research Corp (LRCX)
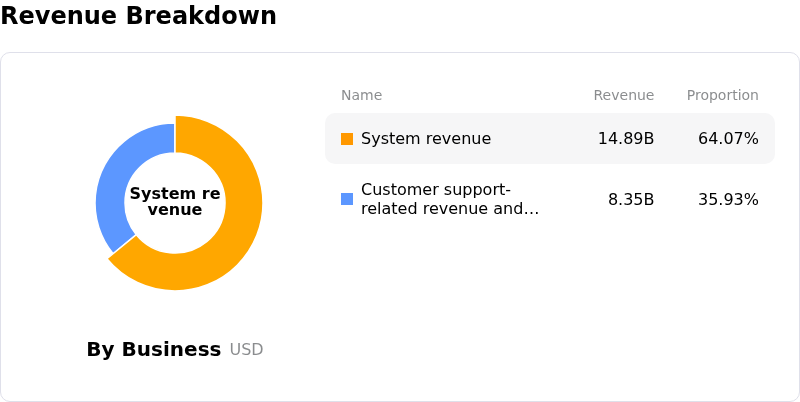
Lam Research Corp (LRCX) is in the Technology Equipment industry. Its latest annual revenue is $23.23B, ranking 12 in the industry. The net profit is $7.27B, ranking 7 in the industry. Company Profile
Over the past month, multiple analysts have rated the company as Buy, with an average price target of $368.88, a high of $500.00, and a low of $213.00.
More details about Lam Research Corp (LRCX)
Company Specific Risks:
- China Trade Restrictions and Revenue Compression: Heightened U.S. export regulations restricting deliveries of advanced semiconductor manufacturing tools to domestic Chinese producers are expected to reduce China's contribution to total revenue below 30%, creating direct top-line headwinds estimated at up to $600 million.
- Concentrated Memory Market Cyclicality: The company's core business remains heavily reliant on capital expenditure cycles from a narrow set of global memory chipmakers for 3D NAND and DRAM, leaving tool orders and equipment revenue highly vulnerable to sudden capex reductions or supply adjustments by key customers.
- Valuation Multiples and Margin Execution Risk: Trading at an elevated trailing price-to-earnings multiple near 50x, the stock faces acute intraday volatility if near-term earnings fail to justify high expectations or if management struggles to execute on its targeted mid-40% operating margin goals.
- Insider Share Divestments: Recent SEC Form 4 disclosures show persistent insider selling by executive management and board directors without concurrent open-market purchasing, dampening short-term institutional sentiment.
Recommended Articles


