


AUD/USD (AUDUSD) Is down 0.51% on Sep 23: What Is Driving the Move?
AUD/USD (AUDUSD) is down 0.51% at Sep 23 06:40(ET), now at $0.70774, with a 7-day down of 0.12%.
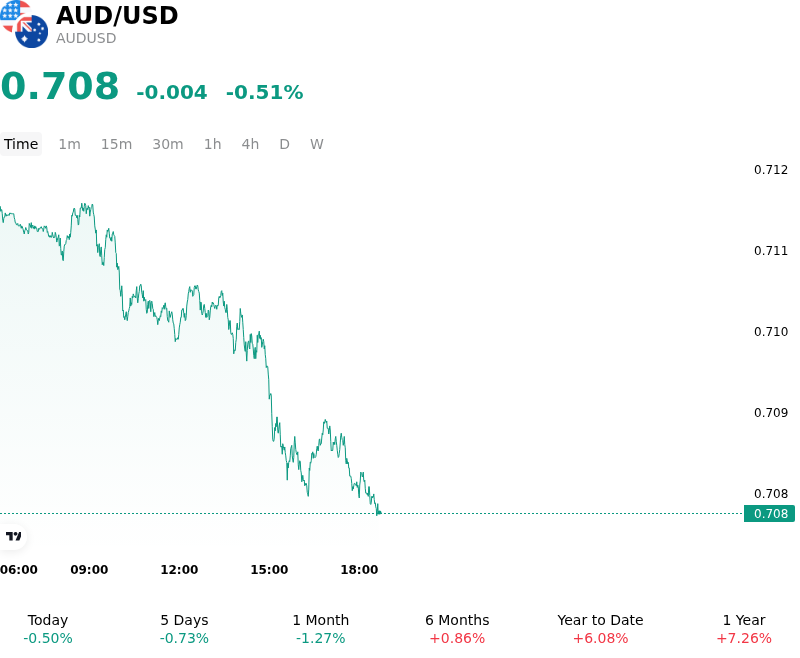
What is driving AUD/USD (AUDUSD)’s stock price down today?
The decline in AUDUSD was primarily driven by broad-based strength in the US dollar as markets continued to price in a hawkish trajectory for Federal Reserve monetary policy. Elevated US Treasury yields, sustained by persistent inflation concerns and resilient economic activity, continued to anchor strong demand for the greenback. Hawkish commentary from Fed officials highlighting persistent upside risks to inflation reinforced expectations for extended monetary tightening, widening yield differentials against major peers and placing downside pressure on risk-sensitive currencies.
Compounding the downward momentum in the Australian dollar was a disappointing domestic macroeconomic release. Australia’s flash purchasing managers index data for September revealed a contraction in manufacturing output alongside a pronounced slowdown in services activity. The drop in new export orders and broader private-sector momentum pointed to softening domestic economic conditions, raising concerns over economic growth even as cost pressures remain sticky.
While expectations for an interest rate increase by the Reserve Bank of Australia at its upcoming policy meeting remain elevated, much of this policy tightening was already fully discounted by financial markets. As a result, hawkish RBA rate expectations failed to provide incremental support for the Australian dollar against a backdrop of aggressive US dollar buying and softening domestic growth metrics. Market participants continue to monitor global energy price developments, sovereign yield movements, and incoming inflation data to gauge whether AUDUSD downside momentum represents an event-driven adjustment or a broader macroeconomic trend.
Technical Analysis of AUD/USD (AUDUSD)
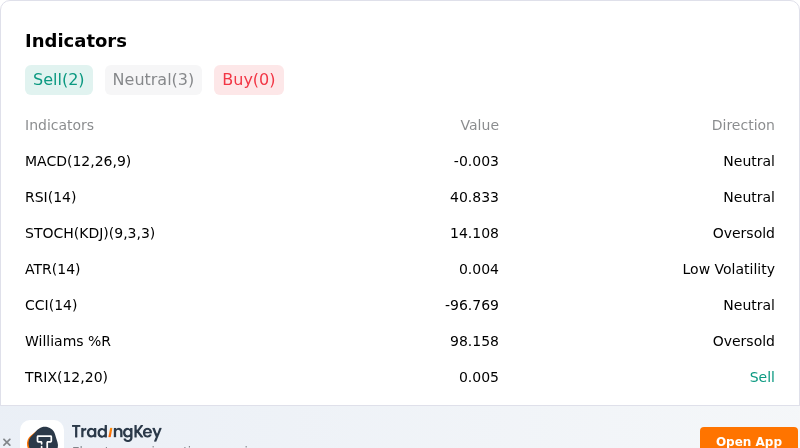
Technically, AUD/USD (AUDUSD) shows a MACD (12,26,9) value of -0.003, indicating a neutral signal. The RSI at 40.833 suggests neutral condition and the Williams %R at 98.158 suggests oversold condition. Please monitor closely.
More details about AUD/USD (AUDUSD)
Recent Events and Risks:
- Domestic Economic Softening and PMI Contraction: Australia’s S&P Global Flash Composite PMI decelerated to 50.8 in September from 52.7 in August, driven by contracting manufacturing output and slowing service sector growth. This weakening private-sector momentum, combined with rising unemployment at 4.5% and stagnant labor productivity, underscores macro headwinds that threaten to cap AUD performance against major peers.
- Federal Reserve Hawkishness and US Dollar Rally: Broad US Dollar strength driven by hawkish comments from Federal Reserve officials has dragged AUD/USD down toward the 0.7100 technical floor. Persistent US inflation concerns tied to energy price shocks and strong consumer demand have elevated Treasury yields, putting direct downside pressure on risk-sensitive currencies like the Australian Dollar.
- RBA Policy Overtightening Risk into Weakening Demand: Major Australian banks have aligned forecasts for an RBA rate hike to 4.60% at the upcoming September decision to counter sticky trimmed-mean inflation. Investors fear that additional rate hikes into an environment of negative real wage growth and moderating household consumption will deepen domestic economic deceleration, creating downside risk for the currency.
- China Trade Friction Concerns Ahead of High-Level Talks: Market participants report elevated downside tail risk for AUD/USD ahead of high-stakes US-China trade talks between Donald Trump and Xi Jinping. Given the Australian Dollar’s heavy exposure to Chinese industrial demand and commodity export prices, renewed tariff threats or disappointing trade headlines pose an immediate trigger for intraday risk-off selloffs.
Recommended Articles


