


Natural Gas - Futures (NATGAS-F) Is up 5.28% on Sep 23: Is the Market Repricing It?
Natural Gas - Futures (NATGAS-F) is up 5.28% at Sep 23 20:00(ET), now at $3.17, with a 7-day up of 9.92%.
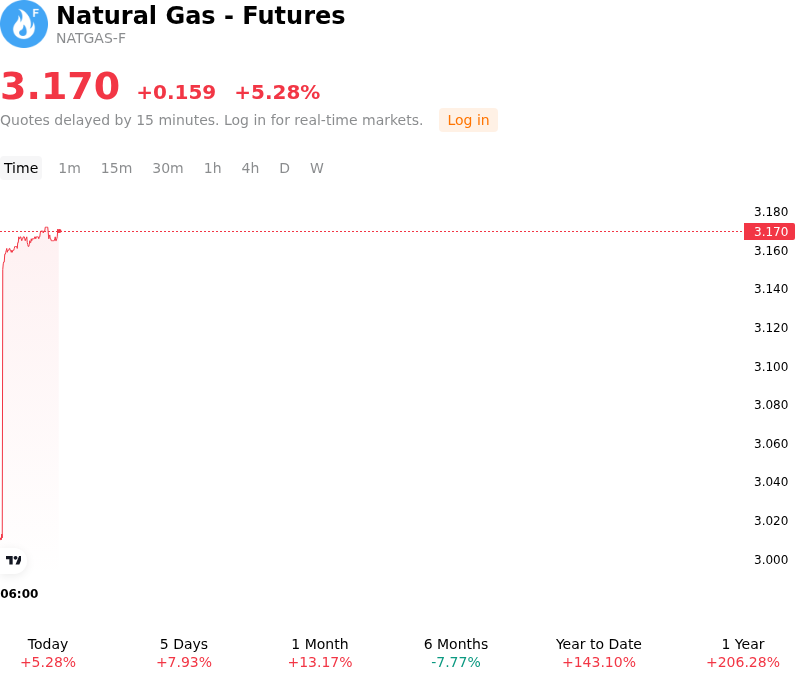
What is driving Natural Gas - Futures (NATGAS-F)’s stock price up today?
The sharp upward momentum in US natural gas futures was primarily driven by updated weather models indicating late-season heat across key Southern and South-Central demand regions. Upward revisions to temperature forecasts extended anticipated cooling degree days deeper into the autumn shoulder season, forcing electric utilities to maintain elevated natural gas power burn to meet persistent air-conditioning demand. This sudden shift altered near-term supply-demand balance expectations, counteracting typical seasonal expectations of subdued power burn and prompting rapid repricing across prompt-month futures contracts.
Substantial institutional positioning played a major role in amplifying price gains. Systematic funds and speculative market participants held sizable short positions heading into late September, leaving the market highly vulnerable to upside squeezes. As prices broke through key technical resistance levels, automated buy-stops and aggressive short-covering triggered rapid capital inflows. This technical breakout was further supported by market expectations of a seasonally lean weekly inventory injection, as sustained late-summer heat and steady feedgas demand at liquefied natural gas export terminals limited storage accumulation relative to five-year averages.
On the supply side, dry gas production in the Lower-48 showed modest pullbacks from peak summer levels, complemented by localized producer curtailments in response to temporary cash price weakness in major producing basins. While medium-term risks remain tied to winter weather forecasts and potential macroeconomic volatility, the price action highlights how tight physical balances and heavy speculative short interest can catalyze powerful upside moves even during traditional shoulder periods. Institutional investors continue to monitor weekly EIA storage prints, LNG feedgas volumes, and early winter weather signals to gauge market trajectory.
Technical Analysis of Natural Gas - Futures (NATGAS-F)
Technically, Natural Gas - Futures (NATGAS-F) shows a MACD (12,26,9) value of 0.045, indicating a buy signal. The RSI at 66.266 suggests neutral condition and the Williams %R at 0.943 suggests overbought condition. Please monitor closely.
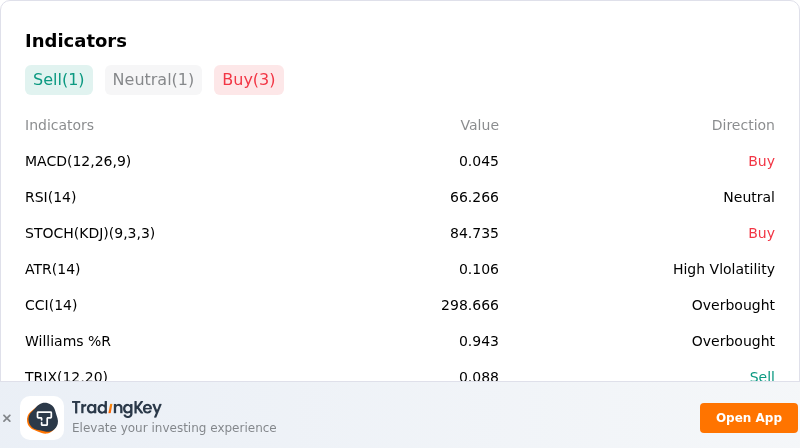
More details about Natural Gas - Futures (NATGAS-F)
Recent Events and Risks:
- Seasonal Weather Moderation and Collapsing Power Demand: Forecasts for late September indicate rapidly moderating autumn temperatures across the U.S. North and East Coast, sharply curtailing cooling degree days and driving daily power sector gas burn down to month-to-month lows of below 40 Bcf/d.
- LNG Export Terminal Maintenance Outages: Scheduled seasonal turnarounds at key facilities—including Cove Point LNG and Cameron LNG—have dragged total U.S. feedgas demand down to multi-week lows of 17.5 to 18.2 Bcf/d, stranding extra natural gas in the domestic market and forcing surplus injections into storage.
- High Lower 48 Dry Production Rates: U.S. natural gas production continues to run near record levels at 111–113 Bcf/d, bolstered by resilient associated gas output from high oil drilling activity in the Permian Basin and strong Marcellus output.
- Substantial Underground Inventory Surplus: Total Lower 48 working gas stockpiles remain comfortably above 3.29 Tcf—standing nearly 3.7% above the five-year historical average—providing a heavy supply buffer that limits upward momentum and reinforces overhead technical resistance on prompt-month contracts.
Recommended Articles


