


BNB (BNBUSD) Is up 1.06% on Sep 21: Here Is Why
BNB (BNBUSD) is up 1.06% at Sep 21 20:10(ET), now at $774.4, with a 7-day up of 6.83%.
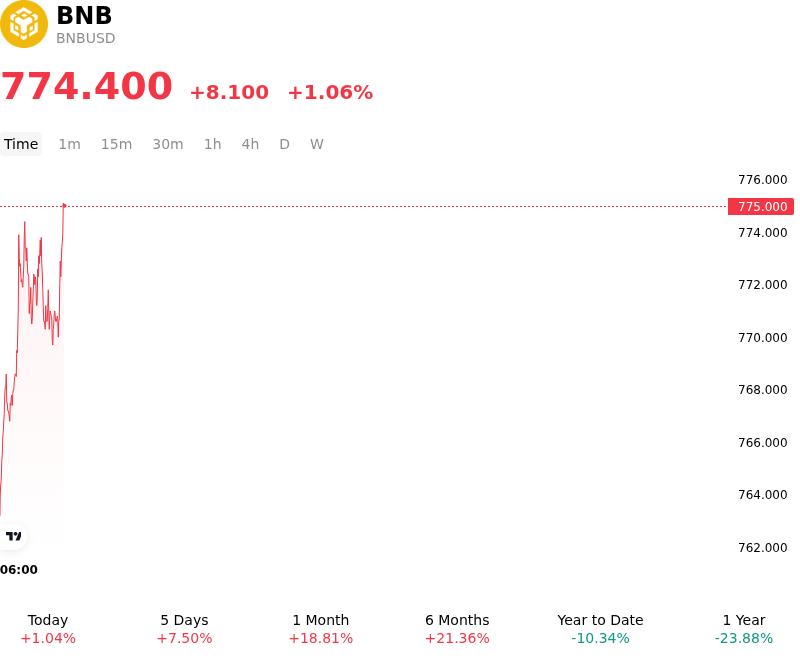
What is driving BNB (BNBUSD)’s stock price up today?
BNB advanced as broader digital asset market sentiment improved, supported by expanding crypto market liquidity and ongoing regulatory clarity developments in major jurisdictions. Capital flowed into high-market-cap utility tokens as institutional risk appetite strengthened across the digital asset space. Increased spot market demand was further reinforced by steady institutional engagement across crypto ecosystem products and favorable macro liquidity conditions, which elevated trading interest and buy-side volume across the native exchange and network infrastructure.
Ecosystem-specific fundamentals provided strong underlying support for the move. BNB Chain has demonstrated robust structural momentum, leading major Layer-1 blockchains in tokenized real-world asset growth throughout the current cycle. Institutional adoption of on-chain real-world assets, combined with expanding network utility across automated infrastructure and payment settlement integrations, continues to enhance long-term adoption expectations. Additionally, ongoing protocol optimizations—including low-fee stablecoin transfer initiatives and improved transaction throughput—boosted overall network activity, sustaining steady transaction fee consumption and reinforcing the token's structural burning tokenomics.
From a market structure perspective, the advance reflected spot-led capital inflows accompanied by orderly derivatives repricing. Perpetual futures funding rates remained balanced throughout the session, signaling that price appreciation was driven primarily by spot accumulation rather than excessive speculative leverage. As the token broke through near-term consolidation levels, minor short-covering activity further supported upward momentum. While institutional investors continue to monitor broader macroeconomic policy shifts and platform regulatory developments, the asset remains supported by deep market liquidity, expanding on-chain economic activity, and strong utility within its native ecosystem.
Technical Analysis of BNB (BNBUSD)
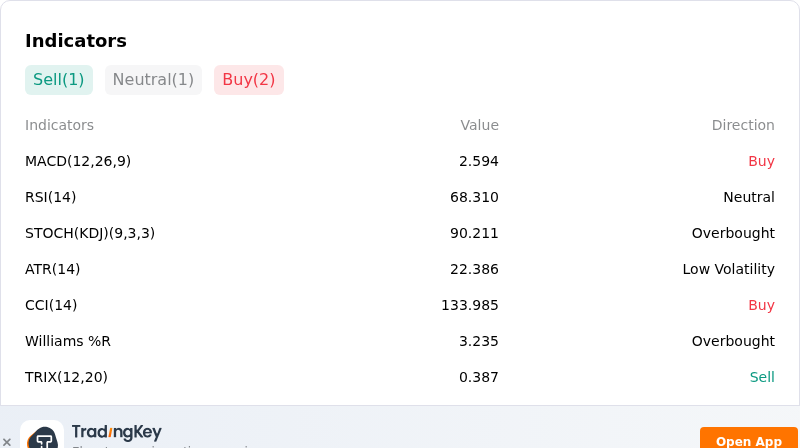
Technically, BNB (BNBUSD) shows a MACD (12,26,9) value of 2.594, indicating a buy signal. The RSI at 68.310 suggests neutral condition and the Williams %R at 3.235 suggests overbought condition. Please monitor closely.
More details about BNB (BNBUSD)
Recent Events and Risks:
- Regulatory and Compliance Overhang: Persistent international legal scrutiny targeting Binance exchange operations and strict regional compliance frameworks like European MiCA generate downside headline risk that discourages institutional dip-buying.
- Derivatives Liquidation Cascades: Heavy long positioning in perpetual futures exposes BNB to downside liquidation cascades near key support levels around $700, exacerbated by high sell-order concentration and unwinding open interest.
- Concentrated Holder Supply Volatility: Exchange vaults and major wallet entities hold over half of the total BNB circulating supply, creating vulnerability to sudden liquidity shocks and steep intraday slippage if key holders reallocate assets.
- Macro Sentiment and Market Spillovers: Broader digital asset market pullbacks, driven by hawkish macroeconomic conditions and stalled crypto-regulatory legislation in major jurisdictions, continue to exert downside pressure across major L1 tokens including BNB.
Recommended Articles


