


Ethereum (ETHUSD) Is down 1.11% on Sep 20: What Do On-Chain Data and Market Sentiment Show?
Ethereum (ETHUSD) is down 1.11% at Sep 20 22:40(ET), now at $2604.22, with a 7-day up of 3.74%.
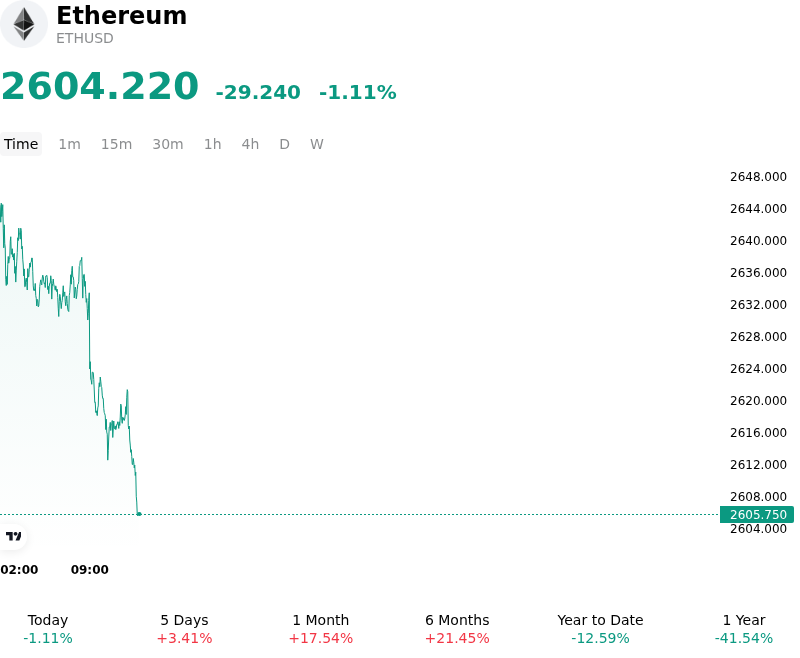
What is driving Ethereum (ETHUSD)’s stock price down today?
The moderate decline in Ethereum reflects a broader risk-off adjustment driven by a tightening macro liquidity environment and temporary profit-taking following a retest of key upper resistance levels. Macroeconomic headwinds surged into focus as the Federal Reserve enacted a rate increase to counter persistent inflationary pressures. Accompanied by elevated U.S. Treasury yields and a resilient U.S. Dollar, higher risk-free yields tightened global dollar liquidity. This shift altered real yield expectations, forcing institutional portfolios to reduce risk-budget allocations across high-beta digital assets and dampening immediate risk appetite.
At the ecosystem level, capital inflows faced friction following mixed institutional spot ETF demand and regulatory delays. The failure of key U.S. digital asset market-structure legislation to clear procedural votes removed an anticipated policy catalyst that institutional allocators had priced in for statutory clarity. Although regulatory agencies introduced temporary exemptions permitting permissioned liquidity pools for tokenized real-world assets, the legislative setback introduced lingering policy uncertainty. Simultaneously, spot Ethereum ETFs experienced inconsistent daily flow patterns, with net outflow sessions dampening spot buying momentum near technical resistance and prompting tactical profit-taking.
Derivatives market positioning also contributed to the soft intraday tone, as elevated open interest invited selective deleveraging and long liquidation flushes. Despite the downside pressure, structural supply dynamics remain supportive over a longer horizon. The proportion of circulating supply locked in network staking contracts continues to absorb available sell-side liquidity, paired with reduced spot exchange reserves. Moving forward, institutional investors remain focused on post-hike Federal Reserve guidance, the trajectory of net spot ETF flows, and protocol testnet developments to gauge structural market direction.
Technical Analysis of Ethereum (ETHUSD)
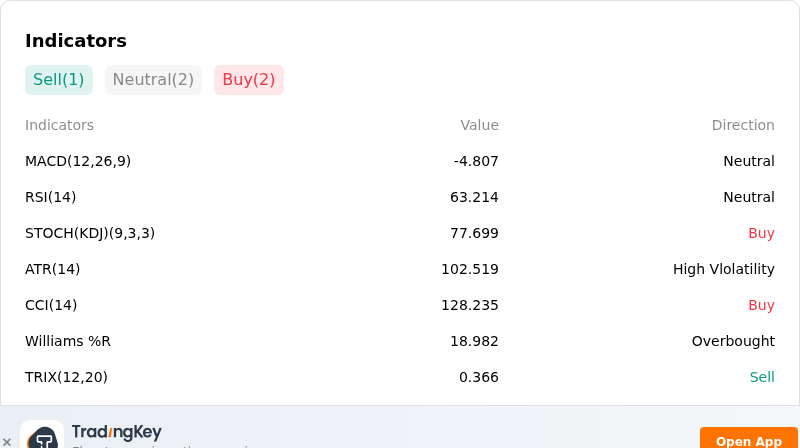
Technically, Ethereum (ETHUSD) shows a MACD (12,26,9) value of -4.807, indicating a neutral signal. The RSI at 63.214 suggests neutral condition and the Williams %R at 18.982 suggests overbought condition. Please monitor closely.
More details about Ethereum (ETHUSD)
Recent Events and Risks:
- Institutional Spot ETF Capital Redemptions: U.S. spot Ethereum ETFs recorded heavy net outflows exceeding $400 million over recent trading sessions, driven by substantial redemptions in BlackRock's ETHA and Bitwise's ETHW, signaling near-term institutional de-risking and eroding spot-market buy liquidity.
- Regulatory Legislative Failure: The failure of the U.S. Senate to advance key crypto regulatory legislation, specifically the CLARITY Act, re-introduced heightened regulatory uncertainty, triggering immediate broad-based sell-offs across ETH and digital asset markets.
- Macroeconomic Tightening and Treasury Yield Pressure: Escalating concerns over hawkish Federal Reserve interest rate policy alongside rising U.S. Treasury yields have tightened fiat market liquidity and fueled risk-off sentiment across speculative asset classes.
- Derivatives Long Liquidations and Technical Support Retests: A sharp wave of forced long liquidations surpassing $180 million has heightened derivatives market fragility, exposing ETH to cascading downside pressure and potential liquidation sweeps if critical support levels between $2,380 and $2,266 break.
Recommended Articles


