


Applovin Corp Stock (APP) Moved Down by 3.35% on Sep 18: What Investors Need To Know
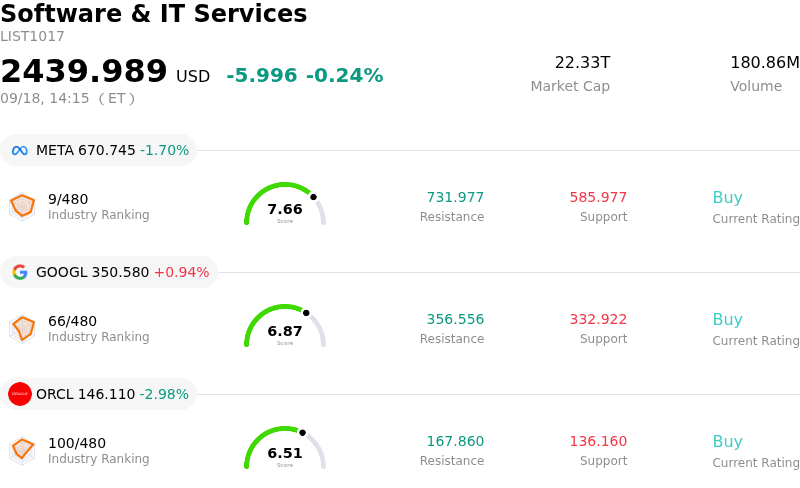
Applovin Corp (APP) moved down by 3.35%. The Software & IT Services sector is down by 0.24%. The company underperformed the industry. Top 3 stocks by turnover in the sector: Meta Platforms Inc (META) down 1.70%; Alphabet Inc Class A (GOOGL) up 0.94%; Oracle Corp (ORCL) down 2.98%.
What is driving Applovin Corp (APP)’s stock price down today?
AppLovin experienced downward pressure and heightened intraday volatility driven by a combination of derivative-driven market mechanics and persistent sector sentiment recalibration. As options contracts reached monthly expiration, elevated trading volume in options and derivative positioning created amplified price swings. Furthermore, the broader digital advertising and software technology sector continues to navigate valuation multiple adjustments following prior multi-year expansions, leading investors to exercise greater caution with high-multiple growth equities.
Company-specific headwinds further weighed on investor sentiment following a series of price target reductions from prominent Wall Street brokerages. Analysts highlighted execution risks surrounding the company's strategic expansion beyond mobile gaming into broader consumer e-commerce advertising. Concerns linger over the pace of artificial intelligence model upgrades and lower-than-expected adoption speed for its self-service ad platform, raising questions regarding short-term growth acceleration and quarterly spending predictability. Additionally, intensifying competitive dynamics from rival ad-targeting engines have heightened scrutiny on the company's long-term pricing power and conversion efficiency.
Compounding the intraday downward momentum is ongoing uncertainty stemming from legal developments. Announcements regarding shareholder class-action lawsuits continue to circulate, keeping litigation risks top of mind for market participants. While AppLovin maintains a strong financial baseline supported by solid cash flow generation and expansion into new verticals, the combination of legal noise, competitive friction, and revised analyst expectations prompted short-term risk reduction among investors.
Technical Analysis of Applovin Corp (APP)
Technically, Applovin Corp (APP) shows a MACD (12,26,9) value of 8.989, indicating a neutral signal. The RSI at 40.808 suggests neutral condition and the Williams %R at 71.725 suggests sell condition. Please monitor closely.
Media Coverage of Applovin Corp (APP)
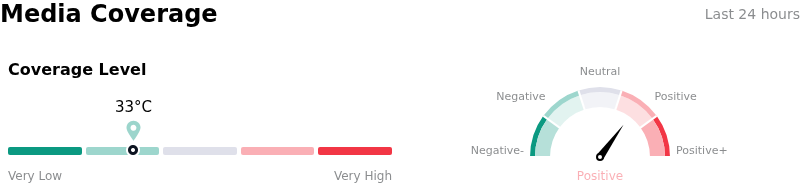
In terms of media coverage, Applovin Corp (APP) shows a coverage score of 33, indicating a low level of media attention. The overall market sentiment index is currently in bullish zone.
Fundamental Analysis of Applovin Corp (APP)
Applovin Corp (APP) is in the Software & IT Services industry. Its latest annual revenue is $5.48B, ranking 57 in the industry. The net profit is $3.33B, ranking 18 in the industry. Company Profile
Over the past month, multiple analysts have rated the company as Buy, with an average price target of $504.78, a high of $790.00, and a low of $325.00.
More details about Applovin Corp (APP)
Company Specific Risks:
- Analyst Price Target Cuts and Growth Sustainability Skepticism: Research firms including BTIG and Bank of America lowered price targets for APP following concerns over whether the company can sustain its 30% annual revenue growth target, citing potential saturation in mobile gaming user acquisition and diminishing sequential returns from automated self-learning model updates.
- Securities Class Action Litigation over AI Capabilities: Shareholder rights law firms have recently filed securities class action lawsuits alleging that AppLovin misrepresented the stability of its AXON AI model improvements, the commercial readiness of its generative AI video creative tool, and the initial traction of its e-commerce advertising expansion.
- Execution Vulnerabilities and Compute Cost Pressures: Operating results exposed fundamental execution risks as quarter-over-quarter model enhancements landed lighter than anticipated, causing a quarterly revenue miss ($1.92 billion actual vs. $1.94 billion consensus) alongside rising compute and inference training costs required to scale next-generation models.
- Heavy Insider Stock Dispositions: Executive leadership and board members have executed substantial equity sales over recent months—including multi-million dollar transactions by the CEO and key directors—adding consistent overhead supply and dampening institutional buying during volatile intraday sessions.
Recommended Articles


