


Solana (SOLUSD) Is down 1.04% on Sep 16: Why It Happened
Solana (SOLUSD) is down 1.04% at Sep 16 21:55(ET), now at $95.45, with a 7-day down of 6.03%.
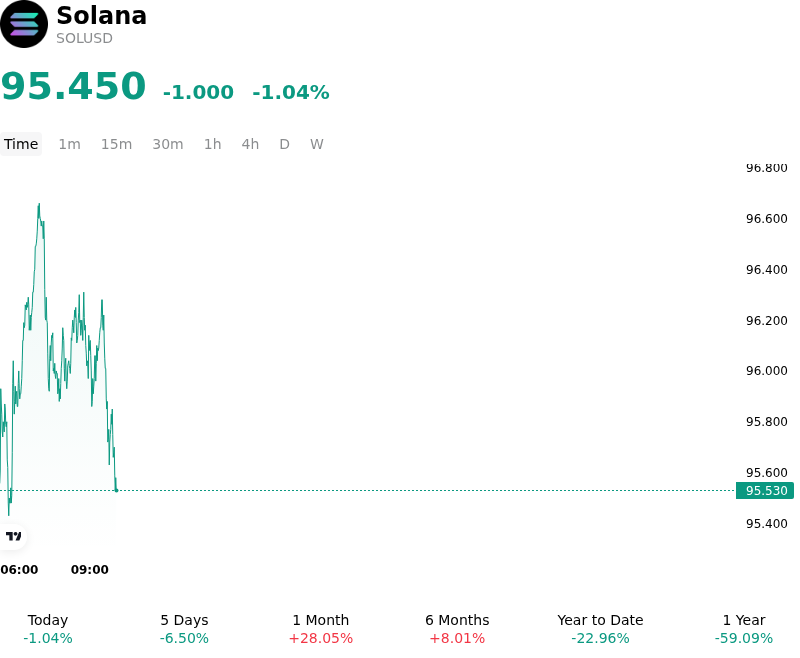
What is driving Solana (SOLUSD)’s stock price down today?
Macroeconomic liquidity pressures and heightened interest rate path uncertainty served as the primary drivers behind the tactical pullback in Solana. Ahead of the Federal Reserve policy decision, broader risk sentiment faced severe headwinds as surging U.S. Treasury yields and persistent inflation data forced a hawkish repricing across global financial markets. High-beta layer-one digital assets like Solana typically display elevated sensitivity to shifts in monetary policy expectations, prompting institutional and macro-focused investors to temporarily trim risk exposure and reduce portfolio leverage in favor of cash and yield-bearing fixed-income instruments.
Beyond the overarching macroeconomic drag, institutional capital flow dynamics contributed to the intraday weakness. Institutional demand experienced a notable pause as inflows into spot Solana exchange-traded products slowed sharply compared to earlier peak periods. The temporary deceleration in spot ETF momentum removed a vital passive buying mechanism that had previously absorbed market liquidity and sustained upward price momentum, leaving the order book more susceptible to routine sell-side distribution and profit-taking.
From a technical and market structure perspective, Solana ran into dense overhead resistance, triggering a consolidation phase. Derivatives positioning reflected long liquidation and position trimming as momentum indicators normalized from elevated levels. Despite this intraday retracement driven by tightening financial conditions and spot flow deceleration, underlying on-chain activity and ongoing protocol performance upgrades continue to provide a structural floor. Consequently, the current price action represents an event-driven macro repricing and liquidity management cycle rather than a fundamental deterioration in Solana ecosystem adoption.
Technical Analysis of Solana (SOLUSD)
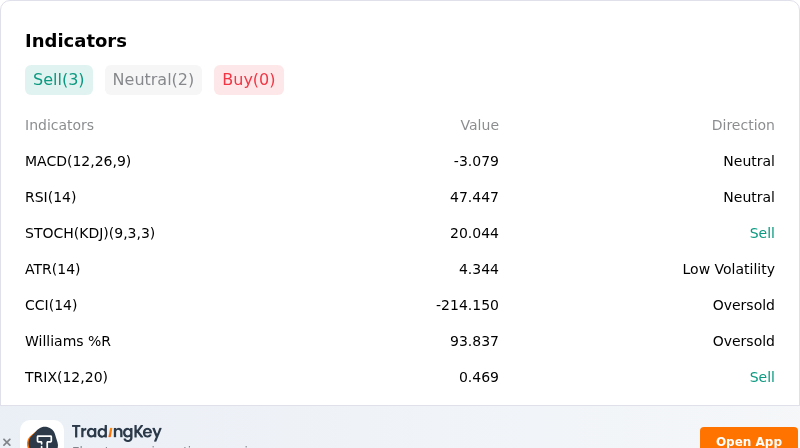
Technically, Solana (SOLUSD) shows a MACD (12,26,9) value of -3.079, indicating a neutral signal. The RSI at 47.447 suggests neutral condition and the Williams %R at 93.837 suggests oversold condition. Please monitor closely.
More details about Solana (SOLUSD)
Recent Events and Risks:
- Macro Tightening and Fed Interest Rate Pressures: Heightened market expectations of a Federal Reserve interest rate hike during the September FOMC meeting, combined with 10-year U.S. Treasury yields holding above 5%, have tightened overall financial conditions and sapped risk appetite for high-beta digital assets like Solana.
- Regulatory Setbacks and Legislative Stalls: The U.S. Senate's failure to advance key crypto market structure legislation (the CLARITY Act) in recent cloture voting renewed broader regulatory uncertainty, triggering immediate risk-off selling across altcoin markets.
- Derivatives Leverage Unwinds and Forced Liquidations: Overextended open interest and heavy long positioning in Solana derivatives led to rapid long liquidation cascades when price pressure mounted, accelerating intraday downside momentum.
- Institutional Outflow Trends and Support Breakdown: Following strong inflows earlier in the quarter, spot Solana exchange-traded funds experienced intermittent net outflows, coinciding with SOL breaking below the critical $100 psychological handle to expose lower technical support zones down to $94.
Recommended Articles


