


WTI (USOIL) Is up 2.96% on Sep 13: What You Need to Watch
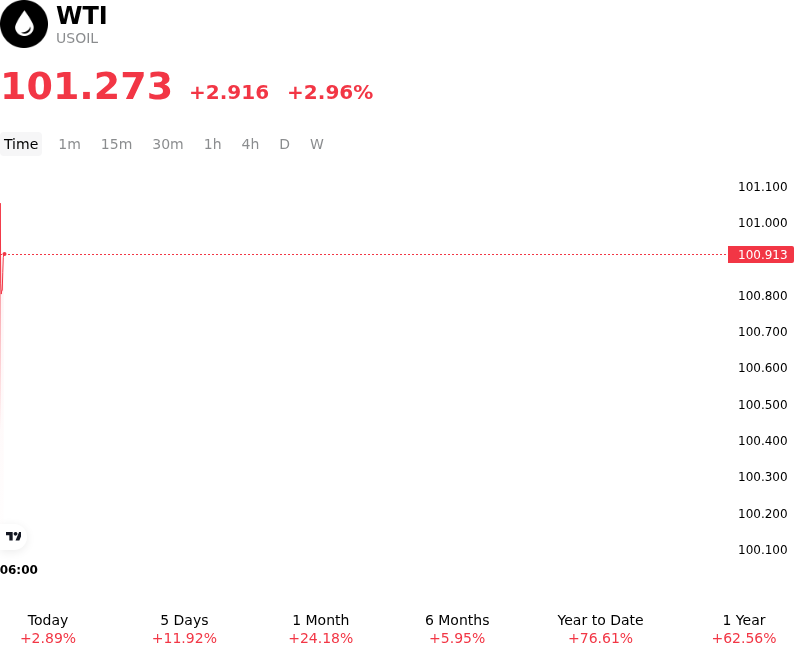
WTI (USOIL) is up 2.96% at Sep 13 18:10(ET), now at $101.273, with a 7-day up of 12.00%.
What is driving WTI (USOIL)’s stock price up today?
Escalating geopolitical friction in the Middle East and expanding security risks across key maritime trade routes provided the primary momentum for West Texas Intermediate crude oil prices. Escalating hostilities in the Gulf region, coupled with renewed threats to energy infrastructure and vital shipping chokepoints such as the Strait of Hormuz and the Red Sea, significantly elevated the market's geopolitical risk premium. Traders aggressively repriced supply disruption risks, anticipating potential delays and rerouting costs for crude shipments originating from the Arabian Peninsula.
Beyond geopolitical risk premiums, tightening physical market balance fundamentals in the United States supported the advance. Persistent commercial crude inventory draws, driven by robust domestic refinery utilization rates and firm export flows, underscored resilient spot demand and reduced excess supply buffers. The combination of structural supply constraints and steady refinery intake reinforced backwardation in the prompt futures curve, indicating that immediate physical tightness continues to outweigh broader macroeconomic concerns regarding high refined product prices and softening long-term global consumption forecasts.
Macroeconomic headwinds and central bank rate expectations remain key variables, as elevated energy prices feed into broader inflation metrics and support higher bond yields. However, institutional capital flows favored energy commodities over broader equity and fixed-income assets, driven by rotation into real assets amid heightened global uncertainty. Investors continue to monitor supply-side risk events, including official weekly inventory reports from the Energy Information Administration, OPEC+ output policy adherence, and ongoing security developments across critical maritime corridors.
Technical Analysis of WTI (USOIL)
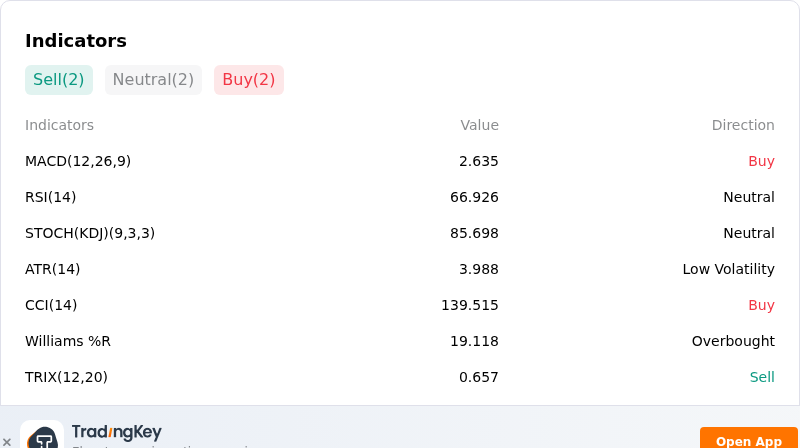
Technically, WTI (USOIL) shows a MACD (12,26,9) value of 2.635, indicating a buy signal. The RSI at 66.926 suggests neutral condition and the Williams %R at 19.118 suggests overbought condition. Please monitor closely.
More details about WTI (USOIL)
Recent Events and Risks:
- Downstream Product Stock Builds and Bearish EIA Inventory Data: Weekly U.S. Energy Information Administration data showed commercial crude inventories drew down by a smaller-than-expected 0.391 million barrels, while gasoline stockpiles unexpectedly grew by 1.269 million barrels and distillates rose by 2.087 million barrels, signaling weak domestic end-user demand and compressing refinery crack spreads.
- Global Demand Growth Downgrades from OPEC and IEA: Market sentiment has deteriorated following downward revisions to 2026 global demand projections, with OPEC trimming its annual growth forecast to 380,000 barrels per day due to industrial cooling in key Asian hubs and the IEA warning that sustained high prices are causing significant global demand destruction.
- Diplomatic Progress Triggering Geopolitical Risk Premium Unwind: WTI crude futures experienced sharp profit-taking following reports of diplomatic meetings in Oman aimed at securing a temporary shipping arrangement through the Strait of Hormuz, prompting market participants to rapidly liquidate long positions and unwind geopolitical risk premiums.
- Hawkish U.S. Monetary Policy Expectations and Macro Headwinds: Recent U.S. inflation data elevated market-implied probabilities of a Federal Reserve interest rate hike to 88%, stoking fears of tighter monetary conditions and slower economic growth alongside falling U.S. consumer sentiment metrics.
Recommended Articles


