


Vertiv Holdings Co Stock (VRT) Moved Down by 5.43% on Sep 10: Facts Behind the Movement
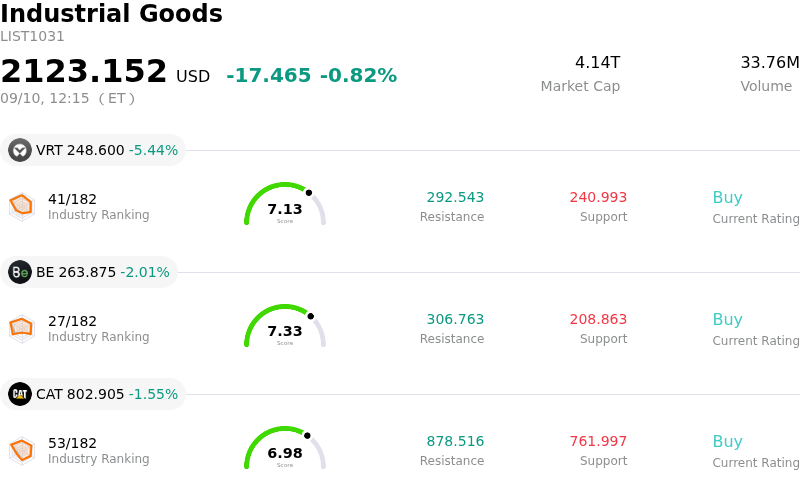
Vertiv Holdings Co (VRT) moved down by 5.43%. The Industrial Goods sector is down by 0.82%. The company underperformed the industry. Top 3 stocks by turnover in the sector: Vertiv Holdings Co (VRT) down 5.44%; Bloom Energy Corp (BE) down 2.01%; Caterpillar Inc (CAT) down 1.55%.
What is driving Vertiv Holdings Co (VRT)’s stock price down today?
Vertiv Holdings experienced downward pressure as investors digested the financial and operational implications of its recent strategic acquisition of UtilityInnovation Group. While the multi-billion dollar transaction aims to strengthen Vertiv's power infrastructure deployment capabilities for artificial intelligence data centers, the sizeable upfront cash outlay and contingent earnout structure have introduced scrutiny around execution risk, integration complexity, and capital allocation priorities.
Beyond deal-related concerns, valuation friction continues to weigh on investor sentiment. Despite delivering robust earnings growth and raising full-year financial guidance, the stock trades at an elevated earnings multiple compared to broader industrial and electrical equipment peers. Market participants remain cautious following management comments regarding project timing shifts on large hyperscale builds and minor supply chain bottlenecks, which have led to short-term revenue timing uncertainties within the rapid buildout of high-density computing clusters.
Institutional commentary remains largely constructive regarding Vertiv's structural positioning in liquid cooling and power distribution for next-generation server architectures. However, recent price movements reflect a broader re-rating across high-beta AI infrastructure stocks as traders adjust risk exposure amidst macro volatility. Moving forward, sustained share performance will depend on management's ability to demonstrate seamless acquisition integration, clear revenue conversion from its growing backlog, and continued margin expansion.
Technical Analysis of Vertiv Holdings Co (VRT)
Technically, Vertiv Holdings Co (VRT) shows a MACD (12,26,9) value of 1.511, indicating a neutral signal. The RSI at 41.354 suggests neutral condition and the Williams %R at 92.463 suggests oversold condition. Please monitor closely.
Media Coverage of Vertiv Holdings Co (VRT)
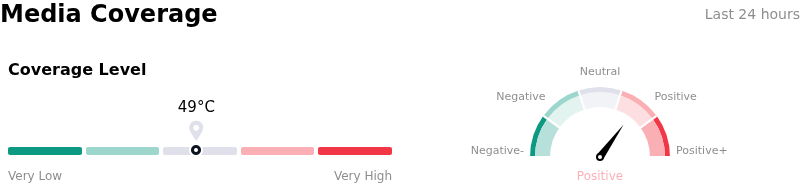
In terms of media coverage, Vertiv Holdings Co (VRT) shows a coverage score of 49, indicating a moderate level of media attention. The overall market sentiment index is currently in bullish zone.
Fundamental Analysis of Vertiv Holdings Co (VRT)
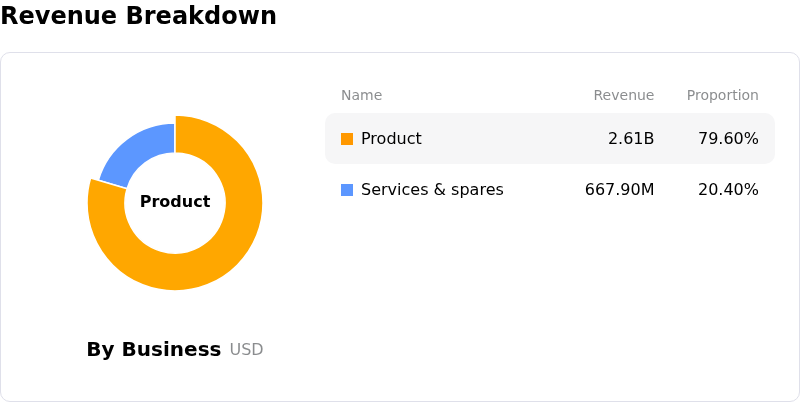
Vertiv Holdings Co (VRT) is in the Industrial Goods industry. Its latest annual revenue is $10.23B, ranking 17 in the industry. The net profit is $1.33B, ranking 13 in the industry. Company Profile
Over the past month, multiple analysts have rated the company as Buy, with an average price target of $331.02, a high of $400.00, and a low of $188.00.
More details about Vertiv Holdings Co (VRT)
Company Specific Risks:
- Acquisition and Capital Execution Risks: Vertiv's agreement to acquire UtilityInnovation Group for up to $2.6 billion ($1.45 billion upfront in cash) introduces substantial integration, operational execution, and cash allocation risks as the company expands into complex microgrid power architecture.
- Valuation Premium and Multiple Compression Exposure: Trading at a trailing P/E ratio near 58x to 60x—substantially higher than the electrical equipment industry average of 33.6x—the stock faces heightened intraday volatility and multiple compression risk if growth momentum moderates.
- Multi-Phase Project Deployment and Revenue Timing Delays: Ongoing institutional concerns persist regarding complex data center delivery schedules and supply chain timing shifts, which previously caused quarterly top-line revenue to miss analyst expectations ($3.27 billion vs. $3.38 billion consensus).
- Insider Disinvestments and Institutional Trimming: SEC Form 4 filings reveal notable insider selling, including a corporate director liquidating nearly 48% of their stock position, alongside institutional stake reductions from major financial holders.
Recommended Articles


