


Teck Resources Ltd Stock (TECK) Moved Down by 7.24% on Sep 10: What Signal Does It Send?
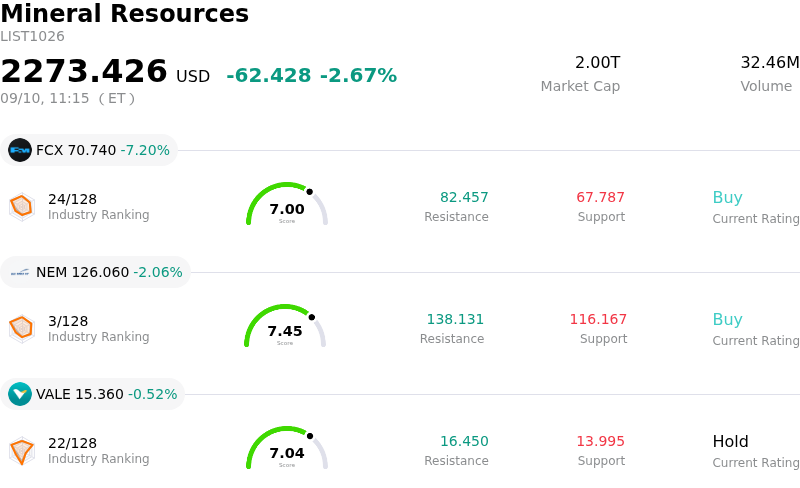
Teck Resources Ltd (TECK) moved down by 7.24%. The Mineral Resources sector is down by 2.67%. The company underperformed the industry. Top 3 stocks by turnover in the sector: Freeport-McMoRan Inc (FCX) down 7.20%; Newmont Corporation (NEM) down 2.06%; Vale SA (VALE) down 0.52%.
What is driving Teck Resources Ltd (TECK)’s stock price down today?
Teck Resources experienced a sharp downward movement, driven primarily by renewed market friction surrounding its pending merger with Anglo American. Investors took profits following a strong multi-month rally that had recently pushed the equity to a new peak. The sell-off reflects a tactical pullback as arbitrage desks and institutional funds re-evaluate regulatory timeline risks against stretched short-term valuation multiples in the basic materials sector.
The primary catalyst for the decline centers on heightened uncertainty regarding global antitrust approvals required for the Anglo American transaction, particularly regulatory review processes in China. As market coverage highlighted potential extensions of the closing timeline into 2027, investors priced in wider deal arbitrage spreads. Additionally, procedural updates regarding debt consent solicitations and transaction conditions reminded traders of the complex hurdles remaining before final execution, dampening short-term sentiment.
Prior to this retreat, Teck Resources had outperformed its peer group substantially, backed by robust quarterly earnings beats, elevated copper demand, and the strategic realignment of its critical minerals portfolio. However, this extended rally left the stock trading at a noticeable premium relative to historical valuation multiples and fair value estimates. With broader industrial metals experiencing price volatility and macroeconomic headwinds weighing on market risk appetite, institutional managers capitalized on the regulatory headline to take profits.
From an institutional perspective, Teck Resources maintains a solid long-term fundamental profile, supported by expanding copper production and a healthy balance sheet. Nevertheless, near-term equity performance will likely remain volatile and sensitive to incremental regulatory developments from key international jurisdictions as well as fluctuations in underlying commodity benchmark prices.
Technical Analysis of Teck Resources Ltd (TECK)
Technically, Teck Resources Ltd (TECK) shows a MACD (12,26,9) value of -0.733, indicating a neutral signal. The RSI at 46.243 suggests neutral condition and the Williams %R at 88.133 suggests oversold condition. Please monitor closely.
Fundamental Analysis of Teck Resources Ltd (TECK)
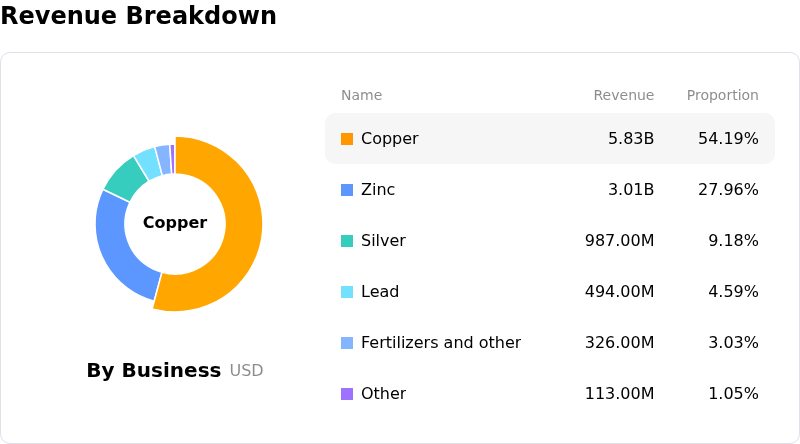
Teck Resources Ltd (TECK) is in the Mineral Resources industry. Its latest annual revenue is $7.86B, ranking 24 in the industry. The net profit is $1.02B, ranking 19 in the industry. Company Profile
Over the past month, multiple analysts have rated the company as Hold, with an average price target of $85.18, a high of $105.00, and a low of $48.32.
More details about Teck Resources Ltd (TECK)
Company Specific Risks:
- Regulatory and Merger Completion Delays: Renewed uncertainty regarding the pending $35 billion merger with Anglo American has created significant timeline and deal-risk concerns, as the transaction remains contingent on pending antitrust approval from Chinese regulators through early 2027.
- Refined Copper Policy and Tariff Exposure: Uncertainty surrounding White House deliberations over refined copper tariffs has pressured underlying copper commodity sentiment, exposing Teck's core metal revenues to immediate market downside.
- Stretched Valuation Premium and Profit-Taking Risk: Having recently traded near a 52-week high of $72.56 at a price-to-earnings ratio near 19.6x, the stock trades above intrinsic fair-value estimates, creating heightened vulnerability to sharp intraday profit-taking.
- Top-Line Contraction and Growth Forecast Headwinds: Institutional analysts highlight underlying operational risks as multi-year projections indicate potential annual earnings declines of nearly 11.7%, reflecting revenue headwinds following the portfolio divestment of non-core assets.
Recommended Articles


