


Freeport-McMoRan Inc Stock (FCX) Moved Down by 7.21% on Sep 10: Key Drivers Unveiled
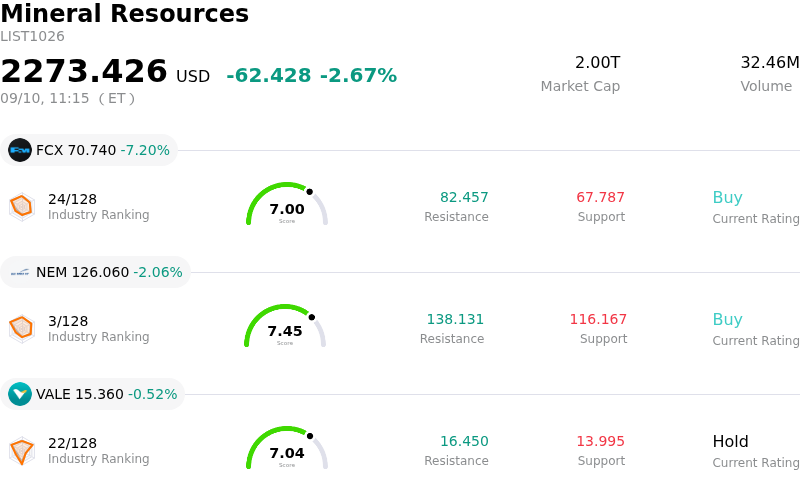
Freeport-McMoRan Inc (FCX) moved down by 7.21%. The Mineral Resources sector is down by 2.67%. The company underperformed the industry. Top 3 stocks by turnover in the sector: Freeport-McMoRan Inc (FCX) down 7.20%; Newmont Corporation (NEM) down 2.06%; Vale SA (VALE) down 0.52%.
What is driving Freeport-McMoRan Inc (FCX)’s stock price down today?
Freeport-McMoRan experienced severe intraday selling pressure driven primarily by a sharp reversal in underlying copper benchmark prices. After reaching historic highs earlier in the session, global copper futures tumbled following reports that the U.S. administration postponed its decision regarding potential import tariffs on refined copper. Concerns over elevated domestic manufacturing costs prompted policymakers to re-evaluate trade restrictions, abruptly deflating the policy and tariff premium that had aggressively buoyed physical copper markets and mining equities in recent weeks.
As one of the world's premier primary copper producers, Freeport-McMoRan exhibits substantial operational leverage to benchmark metal prices. The sudden pullback in spot copper triggered immediate profit-taking across the metals and mining sector, directly dampening near-term revenue and cash flow expectations. While physical inventories had accumulated in domestic warehouses in anticipation of trade barriers, the policy pause highlighted the vulnerability of speculative market positioning relative to underlying industrial consumption trends.
Compounding the downside momentum, Freeport-McMoRan was trading at an extended valuation multiple following a prolonged commodity rally. Elevated price-to-earnings metrics relative to historical medians left the equity with limited buffer against commodity market volatility. Additionally, recent insider sales disclosures and operational sensitivity surrounding second-half production deliverables at key assets, including the Grasberg operations in Indonesia, reinforced institutional risk aversion during the session.
Despite the intraday contraction, Freeport-McMoRan retains strong fundamental backing, supported by long-term structural supply deficits in global copper concentrate and secular demand drivers across technology and power infrastructure. Nevertheless, near-term share performance will likely remain highly volatile and tightly correlated with macro trade policy updates, global inventory shifts, and benchmark metal price fluctuations until definitive regulatory clarity emerges.
Technical Analysis of Freeport-McMoRan Inc (FCX)
Technically, Freeport-McMoRan Inc (FCX) shows a MACD (12,26,9) value of -1.247, indicating a neutral signal. The RSI at 47.631 suggests neutral condition and the Williams %R at 83.406 suggests oversold condition. Please monitor closely.
Media Coverage of Freeport-McMoRan Inc (FCX)
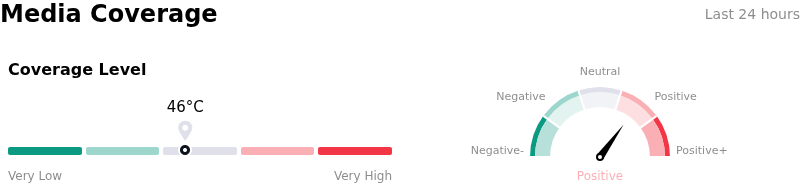
In terms of media coverage, Freeport-McMoRan Inc (FCX) shows a coverage score of 46, indicating a moderate level of media attention. The overall market sentiment index is currently in bullish zone.
Fundamental Analysis of Freeport-McMoRan Inc (FCX)
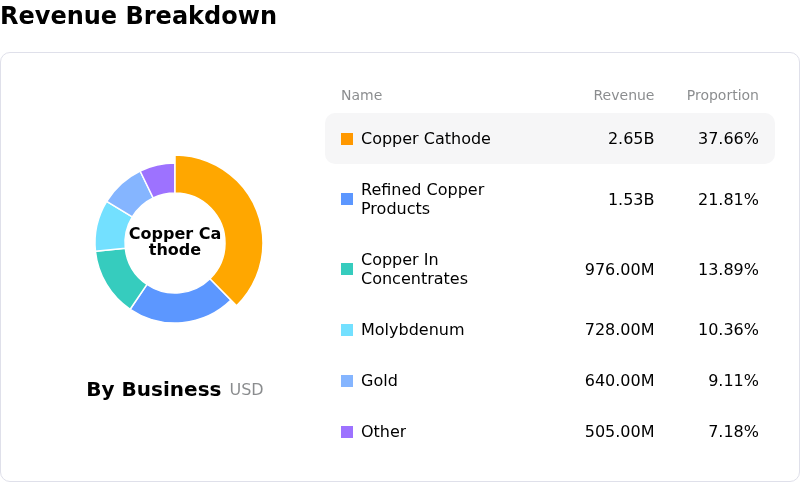
Freeport-McMoRan Inc (FCX) is in the Mineral Resources industry. Its latest annual revenue is $25.91B, ranking 7 in the industry. The net profit is $2.20B, ranking 12 in the industry. Company Profile
Over the past month, multiple analysts have rated the company as Buy, with an average price target of $73.59, a high of $83.00, and a low of $58.50.
More details about Freeport-McMoRan Inc (FCX)
Company Specific Risks:
- Refined Copper Tariff Policy Uncertainty: Intraday volatility spiked following reports that White House policy decisions regarding refined copper import tariffs remain unfinalized, triggering a pre-market stock selloff of over 8% as copper prices retreated from record highs.
- Executive Fiduciary Duty Investigations: Law firms, including Kahn Swick & Foti, LLC, initiated formal investigations into Freeport-McMoRan's officers and directors regarding potential breaches of fiduciary duty related to corporate disclosures following the Grasberg Block Cave mine incident.
- Severe Equity Valuation Premium: FCX is trading at an elevated trailing P/E ratio of approximately 37.5x—substantially higher than its 5-year median of 28.6x—exposing the stock to sharp downside risks if commodity prices pull back or unit net cash costs increase.
- Grasberg Mine Production and Sales Bottlenecks: Operational headwinds from the Grasberg Block Cave mine recovery in Indonesia have constrained 2026 copper sales guidance to 3.1 billion pounds, leaving second-half operational targets heavily back-loaded and vulnerable to potential processing delays.
Recommended Articles


