


SanDisk Corporation Stock (SNDK) Moved Down by 3.92% on Sep 10: What Signal Does It Send?
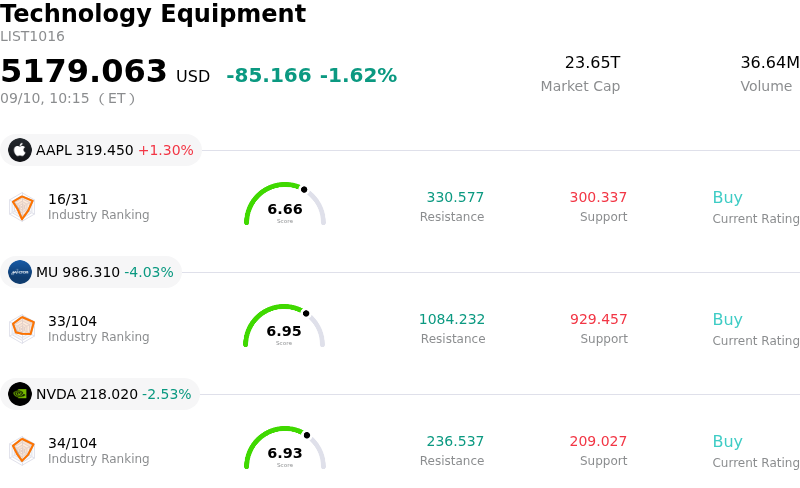
SanDisk Corporation (SNDK) moved down by 3.92%. The Technology Equipment sector is down by 1.62%. The company underperformed the industry. Top 3 stocks by turnover in the sector: Apple Inc (AAPL) up 1.22%; Micron Technology Inc (MU) down 4.04%; NVIDIA Corp (NVDA) down 2.55%.
What is driving SanDisk Corporation (SNDK)’s stock price down today?
SanDisk Corporation experienced notable intraday volatility and closed lower as investors engaged in profit-taking following an extraordinary multi-month rally in the NAND flash memory sector. After benefiting from unprecedented demand for high-capacity enterprise solid-state drives in artificial intelligence data centers, the broader semiconductor and memory space faced consolidation. While structural tailwinds from AI data lake storage remain intact, the stock encountered resistance as market participants digested recent aggressive price appreciation and recalibrated short-term valuation multiples against cyclical memory dynamics.
A key contributor to the selling pressure stems from recent regulatory filings revealing executive insider share dispositions. Securities and Exchange Commission disclosures indicated multi-million dollar equity sales by senior executives, including the chief legal officer and chief technology officer, under pre-arranged Rule 10b5-1 trading plans. Although these transactions were scheduled in advance, the concentration of insider sales near historic highs ignited cautious sentiment among retail and institutional investors. Simultaneously, selective Wall Street research downgrades pointing to elevated valuation risk and aggressive margin expectations prompted funds to trim overweighted positions.
Looking forward, institutional focus remains split between long-term fundamental drivers and cyclical memory market risks. The company continues to benefit from favorable pricing power in flash memory and anticipatory buying ahead of its upcoming benchmark inclusion in the S&P 100 index. However, massive capital expenditure commitments, such as its multi-billion dollar joint manufacturing partnership with Kioxia in Japan, have heightened investor sensitivity to potential oversupply scenarios or a future cooling in spot NAND pricing. In the short term, elevated volatility is likely to persist as the stock consolidates after its historic advance.
Technical Analysis of SanDisk Corporation (SNDK)
Technically, SanDisk Corporation (SNDK) shows a MACD (12,26,9) value of 49.655, indicating a buy signal. The RSI at 57.332 suggests neutral condition and the Williams %R at 29.397 suggests buy condition. Please monitor closely.
Media Coverage of SanDisk Corporation (SNDK)
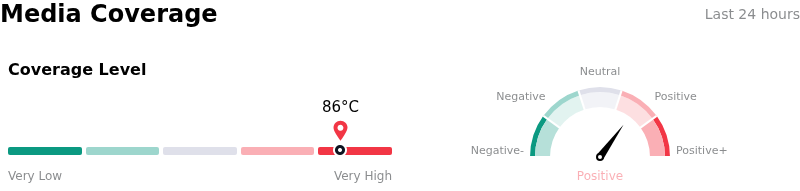
In terms of media coverage, SanDisk Corporation (SNDK) shows a coverage score of 86, indicating a very high level of media attention. The overall market sentiment index is currently in bullish zone.
Fundamental Analysis of SanDisk Corporation (SNDK)
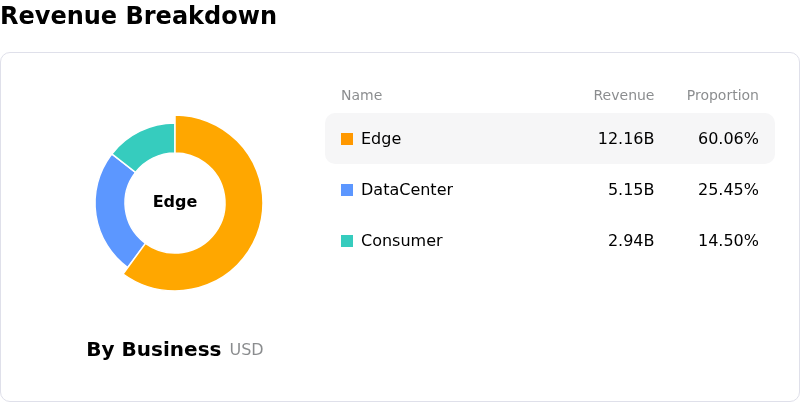
SanDisk Corporation (SNDK) is in the Technology Equipment industry. Its latest annual revenue is $20.25B, ranking 8 in the industry. The net profit is $11.43B, ranking 2 in the industry. Company Profile
Over the past month, multiple analysts have rated the company as Buy, with an average price target of $2124.18, a high of $3000.00, and a low of $1020.00.
More details about SanDisk Corporation (SNDK)
Company Specific Risks:
- NAND Contract Price Resistance: Recent institutional commentary highlights growing concern that PC and smartphone OEMs will resist further NAND flash price hikes due to consumer affordability limits, risking margin compression if expanding memory supply outpaces demand.
- Extreme Intraday Volatility and Speculative Exposure: Elevated implied volatility and heavy retail trading momentum leave the equity susceptible to abrupt intraday drawdowns, mirroring prior volatile stretches where shares suffered sharp, rapid pullbacks during broader semiconductor sell-offs.
- Supply Chain and Geographic Concentration: SanDisk relies on centralized joint-venture manufacturing facilities in Japan for flash chip production, exposing gross margins and operational continuity to regional geopolitical tensions, trade barriers, and foreign currency swings.
- Valuation Overhang and Persistent Insider Selling: Elevated price-to-sales and price-to-book ratios following an unprecedented year-over-year rally, combined with recent institutional trimming and tens of millions in insider stock sales with zero insider buying, indicate potential valuation fatigue.
Recommended Articles


