


KLA Corp Stock (KLAC) Moved Down by 3.69% on Sep 10: Facts Behind the Movement
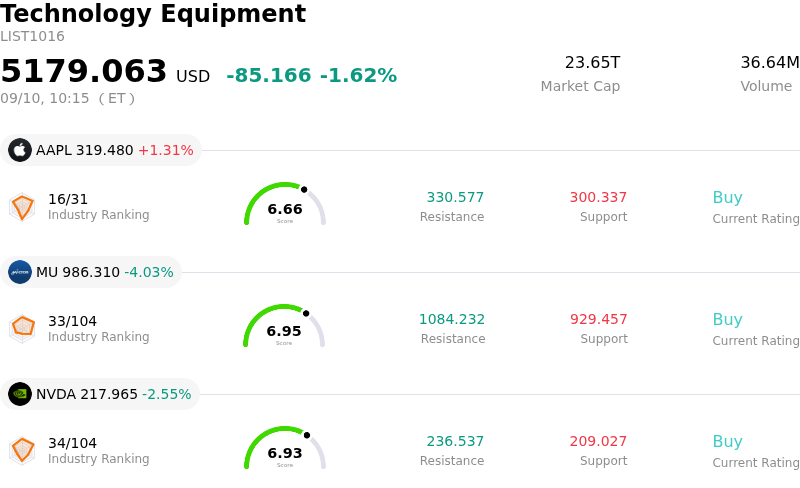
KLA Corp (KLAC) moved down by 3.69%. The Technology Equipment sector is down by 1.62%. The company underperformed the industry. Top 3 stocks by turnover in the sector: Apple Inc (AAPL) up 1.24%; Micron Technology Inc (MU) down 4.04%; NVIDIA Corp (NVDA) down 2.55%.
What is driving KLA Corp (KLAC)’s stock price down today?
KLA Corporation experienced downward pressure and heightened intraday volatility as investors digested management updates from an industry technology conference. While executive leadership reaffirmed strong structural demand for process control and yield management driven by artificial intelligence infrastructure and high-bandwidth memory investments, they also signaled near-term gross margin headwinds. Specifically, management noted that rising memory component costs and ongoing supply chain bottlenecks in optical components have widened gross margin pressure to approximately one hundred basis points, slightly above prior estimates. This operational friction caused market participants to re-evaluate near-term margin expansion despite robust backlog figures and favorable long-term wafer fab equipment forecasts.
The pullback in KLA's shares also reflects broader profit-taking across the semiconductor capital equipment sector. Following a sharp rally earlier in the month sparked by resilient macroeconomic labor data and positive analyst target revisions, high-valuation technology names faced broader selling pressure. Macro headwinds, including elevated Treasury yields and fluctuations in energy prices, further exacerbated investor sensitivity toward premium multiples. As institutional investors trimmed risk exposure across the chip-equipment complex, KLA experienced intraday volatility alongside its industry peers, reflecting a short-term rotation out of recent high-performing technology stocks.
Adding to the cautious sentiment, recent regulatory disclosures revealed notable insider equity sales by executive officers, which introduced headline risk and tempered institutional enthusiasm. Nevertheless, the fundamental outlook for KLA remains anchored by its dominant market position in process control and inspection systems, where node transitions, advanced packaging, and hybrid bonding demand continue to increase manufacturing complexity. While near-term supply chain constraints and margin headwinds are generating volatility, multi-year tailwinds from AI infrastructure buildouts continue to underpin the company's broader growth thesis.
Technical Analysis of KLA Corp (KLAC)
Technically, KLA Corp (KLAC) shows a MACD (12,26,9) value of 1.888, indicating a neutral signal. The RSI at 41.071 suggests neutral condition and the Williams %R at 63.308 suggests sell condition. Please monitor closely.
Media Coverage of KLA Corp (KLAC)
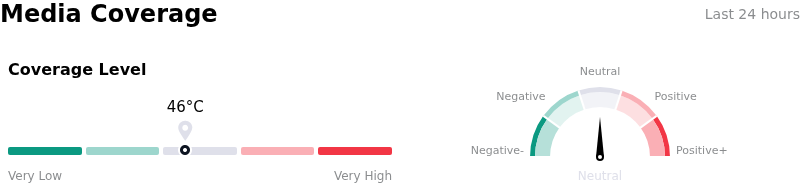
In terms of media coverage, KLA Corp (KLAC) shows a coverage score of 46, indicating a moderate level of media attention. The overall market sentiment index is currently in neutral zone.
Fundamental Analysis of KLA Corp (KLAC)
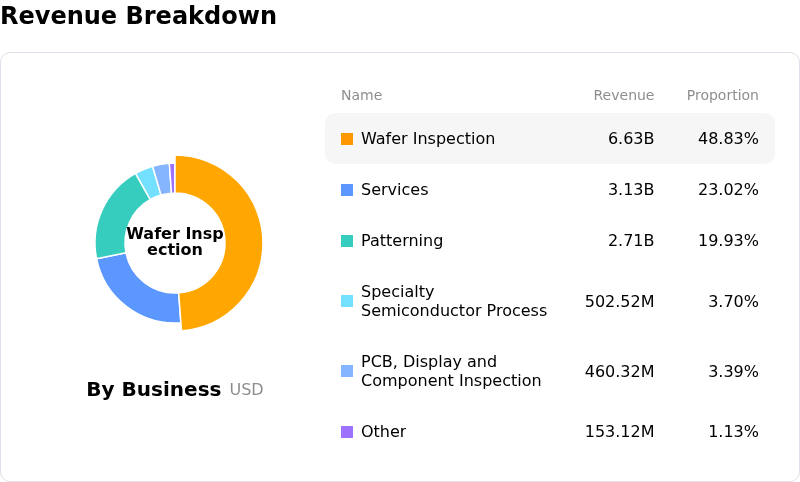
KLA Corp (KLAC) is in the Technology Equipment industry. Its latest annual revenue is $13.58B, ranking 15 in the industry. The net profit is $4.83B, ranking 11 in the industry. Company Profile
Over the past month, multiple analysts have rated the company as Buy, with an average price target of $229.27, a high of $325.00, and a low of $138.80.
More details about KLA Corp (KLAC)
Company Specific Risks:
- Elevated Valuation and Multiple Compression: Trading at a P/E ratio exceeding 50x and near multi-year valuation highs following its recent stock split, KLAC faces heightened downside volatility and multiple compression if growth expectations moderate or tech sector positioning resets.
- Geopolitical Exposure to China Export Restrictions: KLA relies heavily on Chinese wafer fabricators for a significant portion of its process control equipment sales, leaving the company uniquely vulnerable to sudden revenue disruption if U.S. regulators tighten tech export controls.
- Decelerating Revenue Growth and Margin Contraction: Recent quarterly metrics demonstrate sequential top-line deceleration, and forward guidance indicates impending gross margin pressure, provoking concerns among institutional analysts about near-term earnings growth.
- Executive Insider Divestments at Record Levels: SEC filings highlight substantial insider share sales by top corporate leaders, including the Chief Executive Officer and Chief Financial Officer, without matching open-market purchases, signaling cautious management sentiment near peak stock levels.
Recommended Articles


