


XRP (XRPUSD) Is down 1.04% on Sep 10: Key Drivers to Watch
XRP (XRPUSD) is down 1.04% at Sep 10 00:50(ET), now at $1.389, with a 7-day down of 5.57%.
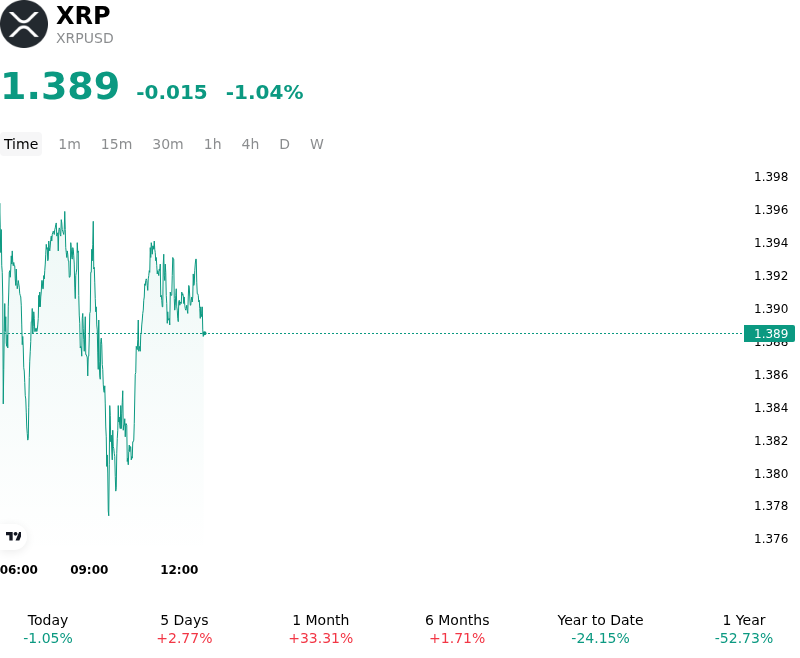
What is driving XRP (XRPUSD)’s stock price down today?
The minor retreat in XRP reflects a period of natural market consolidation following a strong multi-week rally that pushed the asset significantly higher from its August lows. As broader cryptocurrency market momentum paused, with Bitcoin consolidating below major overhead resistance, major altcoins experienced modest profit-taking. This price digestion aligns with short-term technical indicators signaling overbought conditions, prompting systematic funds and short-term traders to reduce gross exposure near overhead technical resistance.
Institutional dynamics also contributed to the softer session. Following several consecutive weeks of positive net allocations into spot XRP exchange-traded products, institutional flow metrics indicated a brief deceleration and selective profit-taking, reflecting temporary demand fatigue among institutional allocators. In derivatives markets, perpetual futures funding rates normalized as leveraged long positioning unwound. Macroeconomic headwinds, including firm U.S. economic data and elevated Treasury yields ahead of upcoming Federal Reserve policy decisions, further limited immediate risk-on appetite across the digital asset space.
Underlying structural expectations remain balanced as investors monitor key regulatory and network catalysts. Market participants are maintaining a cautious posture ahead of the U.S. Senate procedural vote on the CLARITY Act, where legislative uncertainty has kept event risk premiums elevated. Concurrently, on-chain fundamentals are supported by the scheduled mainnet activation of the XRP Ledger 3.3.0 protocol upgrade, which introduces enhanced vault security and expanded institutional lending capabilities. While long-term network adoption and institutional settlement metrics continue to build, near-term price action remains governed by macro liquidity constraints and tactical portfolio rebalancing.
Technical Analysis of XRP (XRPUSD)
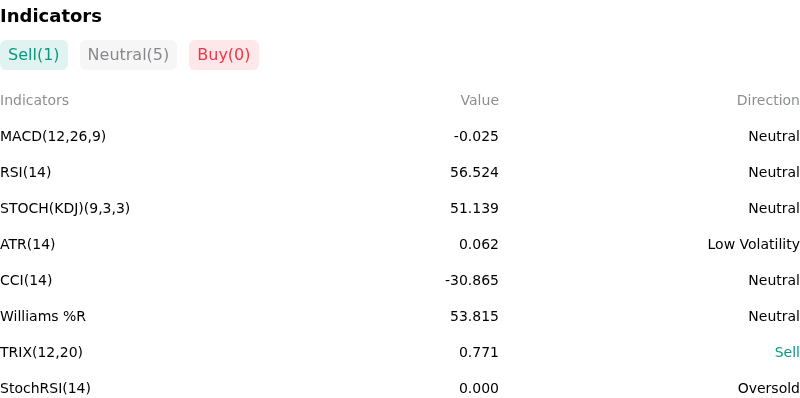
Technically, XRP (XRPUSD) shows a MACD (12,26,9) value of -0.025, indicating a neutral signal. The RSI at 56.524 suggests neutral condition and the Williams %R at 53.815 suggests neutral condition. Please monitor closely.
More details about XRP (XRPUSD)
Recent Events and Risks:
- Legislative Uncertainty Surrounding the CLARITY Act Cloture Vote: Anticipation around the upcoming U.S. Senate procedural cloture vote on the Digital Asset Market Clarity Act on September 15 has introduced binary event risk; with prediction market odds for final passage remaining under 20%, any legislative roadblock or failure to reach the required 60-vote threshold could trigger a sharp downside repricing across XRP markets.
- Derivatives Microstructure Vulnerabilities and Long Squeeze Cascades: Recent pullbacks to $1.38 triggered forced margin liquidations where hourly long liquidations exceeded short losses by over a hundredfold, demonstrating that overcrowded long positioning near the $1.43–$1.45 resistance zone leaves XRP vulnerable to rapid liquidation cascades if support fails.
- Contraction in Futures Open Interest and Net Taker Selling Imbalances: Open interest across XRP perpetual futures has contracted significantly from peak levels down to approximately $3.1 billion, coupled with persistent sell-side net taker volume imbalances on major derivatives exchanges, signaling muted spot buying conviction and active bearish hedging.
- Escrow Unlocks and Exchange Supply Overhangs: Periodic scheduled XRP escrow releases alongside localized spikes in exchange deposit inflows from large holders continue to expand active circulating supply, increasing downside risk toward lower technical support levels at $1.35 and $1.25 under broader risk-off market conditions.
Recommended Articles


