


Ethereum (ETHUSD) Volatility Intensified on Sep 5: What You Should Know
Ethereum (ETHUSD) is up 1.16% at Sep 5 13:10(ET), now at $2477.17, with a 7-day up of 1.10%.
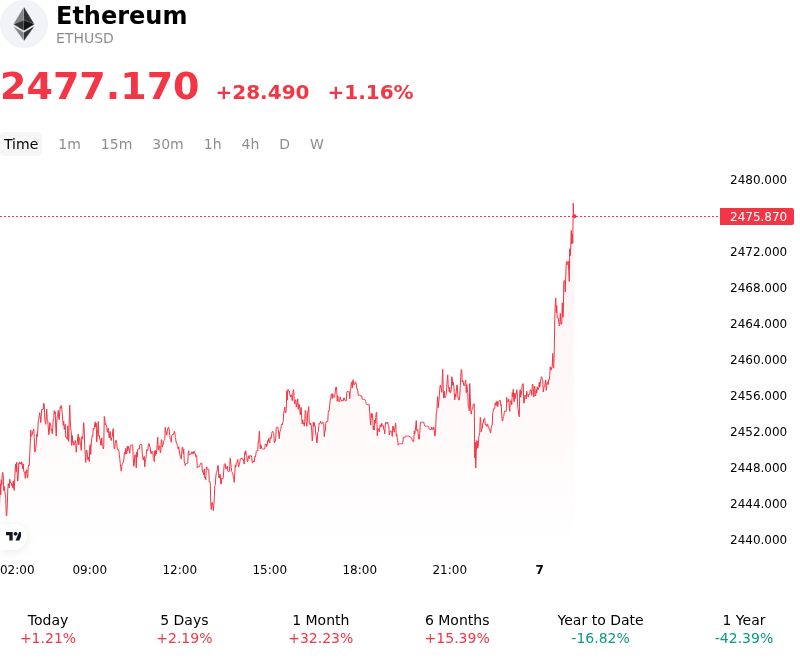
What is driving Ethereum (ETHUSD)’s stock price up today?
Ethereum advanced as broader macro liquidity conditions improved and shifting Federal Reserve policy expectations reinvigorated risk appetite across digital assets. Comments from Federal Reserve leadership signaling potential flexibility regarding interest rate decisions provided immediate relief to crypto markets, putting downward pressure on the US dollar and benchmark Treasury yields. This macroeconomic tailwind re-energized capital flows into high-beta digital assets, allowing Ethereum to absorb recent selling pressure and reclaim key technical support levels.
Institutional participation through spot Ethereum exchange-traded funds reinforced the upward momentum, as net inflows resumed following a brief period of fund redemptions. Renewed allocations into primary institutional ETF products demonstrated sustained demand for ETH as a core portfolio asset. This spot buying helped improve order-book depth on centralized exchanges, providing a stable liquidity foundation that encouraged both systematic and discretionary investors to rebuild long positions.
On-chain metrics and derivatives positioning further fueled the intraday advance. Network activity across Ethereum Layer-2 scaling solutions remained resilient, while staking participation continued to lock up supply, keeping liquid circulating inventory constrained on exchanges. In the derivatives market, the sudden move higher triggered liquidations among short-positioned leveraged accounts, forcing short covering that amplified price expansion during the trading session.
Institutional investors continue to evaluate Ethereum through the combined framework of global liquidity conditions and fundamental ecosystem adoption. While short-term price volatility may persist ahead of upcoming macroeconomic data releases and central bank meetings, the underlying structural drivers—including ETF demand, Layer-2 expansion, and steady staking yields—maintain a favorable structural backdrop. Investors remain focused on monitoring global interest rate trajectories, regulatory developments, and broader risk-asset liquidity conditions.
Technical Analysis of Ethereum (ETHUSD)
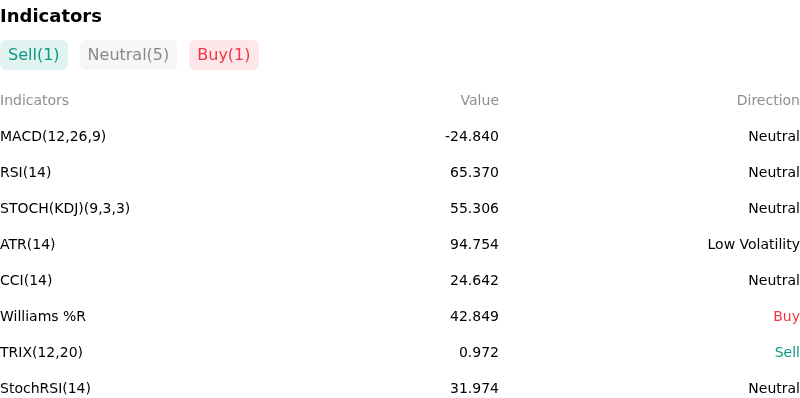
Technically, Ethereum (ETHUSD) shows a MACD (12,26,9) value of -24.840, indicating a neutral signal. The RSI at 65.370 suggests neutral condition and the Williams %R at 42.849 suggests buy condition. Please monitor closely.
More details about Ethereum (ETHUSD)
Recent Events and Risks:
- Massive On-Chain Whale Deposits: On-chain analytics recently tracked a major whale wallet transferring over 167,000 ETH (worth approximately $408 million) to centralized exchanges, creating immediate overhead supply pressure and triggering market fears of a large spot liquidation.
- Derivatives Leverage and Liquidation Risk: Derivatives market data indicates severe liquidation risk with over $1 billion in leveraged long positions vulnerable if ETH breaks below the key $2,350–$2,400 support zone, threatening to trigger a rapid liquidation cascade.
- Slowing ETF Demand and Institutional Disinvestment: Momentum for U.S. spot Ethereum ETFs has faltered, with recent sessions turning to net outflows after a prolonged inflow streak, reflecting weakened institutional spot demand as prices struggle to hold structural resistance.
- Macro Risk-Off and Rate Headwinds: Rising U.S. Treasury yields and surging energy prices driven by Middle East geopolitical tensions have reinforced hawkish Federal Reserve rate expectations, diminishing risk appetite and draining liquidity from macro-sensitive digital assets like Ethereum.
Recommended Articles


