


Natural Gas (NATGAS) Is up 2.10% on Sep 4: Is the Market Repricing It?
Natural Gas (NATGAS) is up 2.10% at Sep 4 08:30(ET), now at $3.008, with a 7-day up of 4.05%.
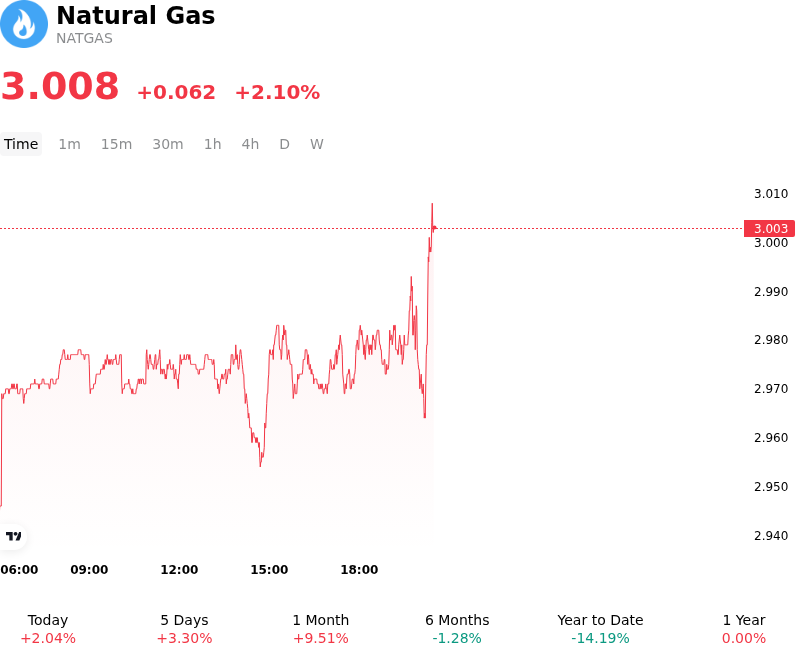
What is driving Natural Gas (NATGAS)’s stock price up today?
The advancement in natural gas futures was primarily driven by a tighter-than-expected domestic supply-demand balance, highlighted by a smaller-than-average weekly underground storage injection. The US Energy Information Administration reported a net storage build that lagged historical seasonal norms, narrowing the surplus relative to the five-year average. Late-summer injection figures demonstrated that strong power-sector burn and sustained feedgas intake at liquefied natural gas export facilities continue to absorb domestic output, preventing heavy inventory accumulation as the market transitions toward autumn.
Elevated power generation demand provided additional momentum as updated weather forecasts projected above-normal temperatures across major consuming regions in the Midwest and eastern United States. Lingering heat across the southern tier maintained strong residential and commercial air-conditioning loads, delaying the traditional shoulder-season drop in power burn. On the supply side, while overall lower-48 production remained healthy, regional pipeline constraints and robust power sector burn kept physical market balances tighter than national headline production figures suggested.
Broader global energy dynamics and institutional positioning further reinforced the upward trajectory. Escalating geopolitical friction in key international maritime transit routes stoked global supply security concerns, pushing international gas benchmarks higher and strengthening expectations for sustained maximum-capacity utilization at domestic LNG export terminals. With elevated cooling demand projected to persist alongside lean weekly storage builds through mid-September, institutional capital flows shifted toward re-establishing long exposure ahead of the upcoming winter heating season.
Technical Analysis of Natural Gas (NATGAS)
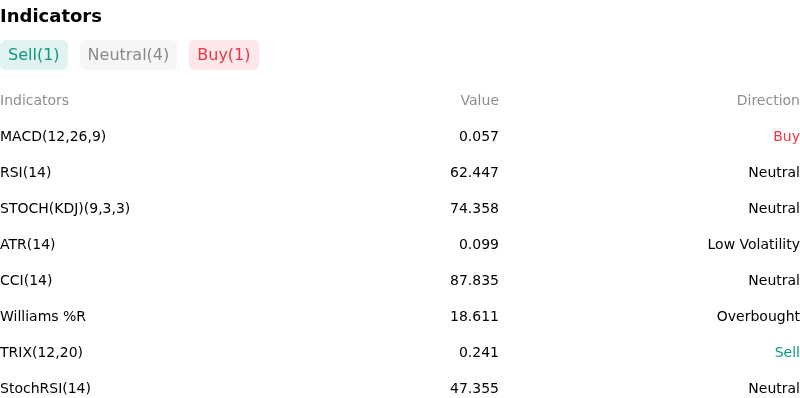
Technically, Natural Gas (NATGAS) shows a MACD (12,26,9) value of 0.057, indicating a buy signal. The RSI at 62.447 suggests neutral condition and the Williams %R at 18.611 suggests overbought condition. Please monitor closely.
More details about Natural Gas (NATGAS)
Recent Events and Risks:
- Abundant Seasonal Storage Surplus: Recent EIA inventory data confirmed a weekly injection of 30 Bcf, keeping total U.S. natural gas stocks at 3,214 Bcf—5.2% above the five-year seasonal average—which underscores comfortable domestic supply and triggers selling pressure near key psychological resistance levels.
- High Dry Gas Production and Active Rigs: Domestic Lower-48 dry gas output remains elevated around 114.2 Bcf/d (up 5.6% year-over-year), while Baker Hughes reported active gas rigs near five-month highs at 132 units, maintaining structural supply overhang on prompt-month futures.
- Mild Autumn and Winter Weather Forecasts: Long-range meteorological models highlighting a strengthening El Niño pattern threaten to bring unseasonably warm temperatures to major Northern Hemisphere population centers this fall and winter, significantly dampening projected residential space heating demand.
- LNG Feedgas Flow Nominations Drop: Net gas flows to U.S. liquefied natural gas export terminals dipped to 19.2 Bcf/d (down 1.7% week-over-week) as seasonal maintenance and operational revisions at Gulf Coast facilities temporarily restrict export demand.
Recommended Articles


