


Solana (SOLUSD) Suddenly Goes down 1.17% on Sep 4: What You Need to Watch
Solana (SOLUSD) is down 1.17% at Sep 4 00:05(ET), now at $102.69, with a 7-day down of 0.17%.
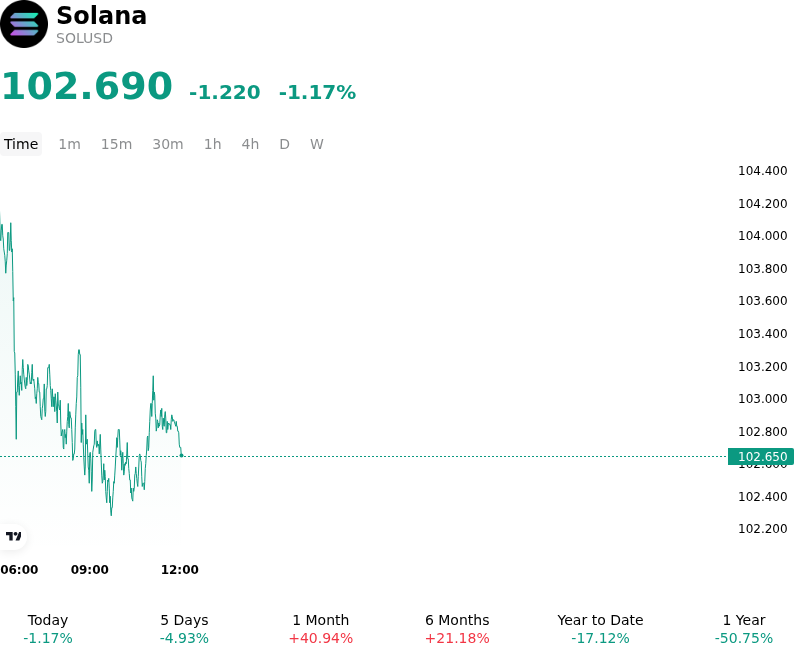
What is driving Solana (SOLUSD)’s stock price down today?
Solana experienced a modest intraday pullback driven primarily by short-term profit taking, derivatives market positioning resets, and localized risk-off sentiment across the broader digital asset market. Following a multi-week appreciation that tested key overhead resistance near the $103 to $105 technical threshold, leveraged long positions encountered liquidations as upward momentum stalled, triggering liquidity-driven selling. This tactical retreat reflected broader macroeconomic caution, as institutional investors digested evolving Federal Reserve policy expectations and elevated benchmark Treasury yields, leading traders to temporarily reduce risk exposure across high-beta Layer-1 assets.
From a microstructural perspective, market dynamics were further constrained by scheduled September token unlocks across select Solana ecosystem protocols, which introduced incremental supply and prompted proactive hedging activity among market makers. While institutional spot ETF flows remained net positive and on-chain decentralized exchange volumes maintained strong market share, perpetual futures markets underwent a necessary deleveraging process. The resulting normalization of funding rates and derivative open interest suggests the decline was a technical consolidation designed to flush out excess leverage rather than a deterioration in core network liquidity.
From an institutional framework, the price movement represents a routine market pause within a broader structural accumulation trend. Solana retains solid fundamental backing, highlighted by elevated active address counts, growing real-world asset tokenization, and recent validator governance approvals designed to lower future token issuance rates. Professional market participants continue to monitor broader global liquidity trends, macroeconomic interest rate trajectories, and institutional spot product inflows to gauge the sustainability of the ongoing cycle before re-establishing aggressive long exposure.
Technical Analysis of Solana (SOLUSD)
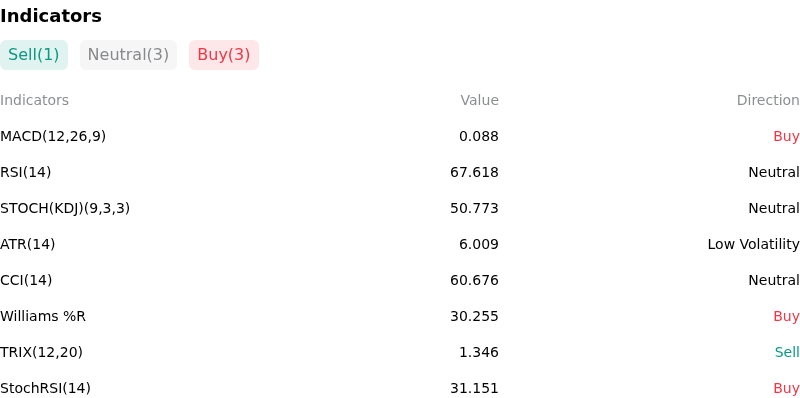
Technically, Solana (SOLUSD) shows a MACD (12,26,9) value of 0.100, indicating a buy signal. The RSI at 67.811 suggests neutral condition and the Williams %R at 29.859 suggests buy condition. Please monitor closely.
More details about Solana (SOLUSD)
Recent Events and Risks:
- Derivatives Long Squeeze and Mass Liquidations: A broader crypto market drawdown forced over $27 million in long liquidations for Solana derivatives as the asset breached the psychological $100 threshold, amplifying intraday selling pressure and threatening further cascading stop-losses across leveraged accounts.
- Breakdown of Crucial Technical Support Levels: Solana lost its multi-week breakout base between $102 and $103, dipping to intraday lows around $98.30. With negative MACD momentum and a declining RSI, failure to swiftly reclaim $100 exposes SOL to deeper downside support targets near its 20-day EMA at $94.09 and 50-day EMA at $85.79.
- Macroeconomic De-risking and Yield Pressures: A surge in crude oil prices and rising U.S. Treasury yields sparked broad risk-off sentiment across financial markets, elevating borrowing costs and dampening spot buying appetite for high-beta digital assets like Solana.
- Derivatives Market Skew and Downside Hedging: Prediction and options market indicators reflect a heavy downside tilt, with event contract traders pricing in a 67% probability of SOL testing $90 before month-end. This structural vulnerability leaves leveraged positions exposed to sudden liquidation squeezes without adequate spot market absorption.
Recommended Articles


