


Amphenol Corp Stock (APH) Moved Up by 102.65% on Sep 3: Facts Behind the Movement
Amphenol Corp (APH) moved up by 102.65%. The Technology Equipment sector is up by 0.24%. The company outperformed the industry. Top 3 stocks by turnover in the sector: NVIDIA Corp (NVDA) up 2.54%; Apple Inc (AAPL) up 0.75%; Broadcom Inc (AVGO) down 3.21%.
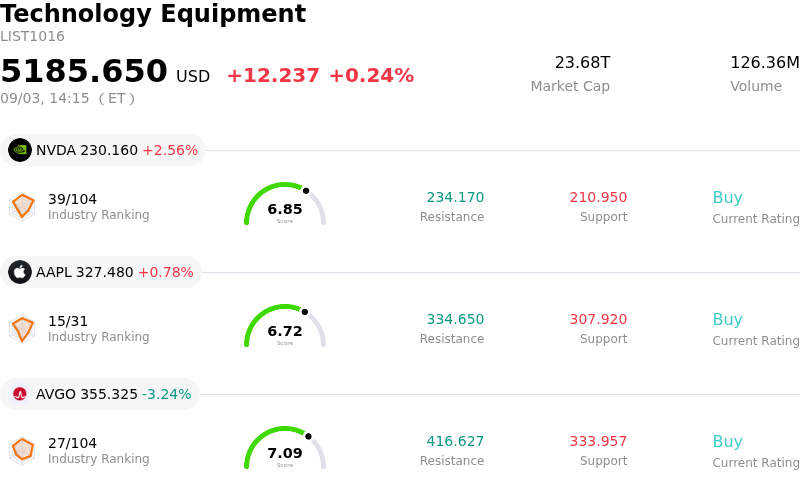
What is driving Amphenol Corp (APH)’s stock price up today?
The primary driver behind the upward price action and heightened intraday volatility in Amphenol Corporation is the execution of its two-for-one stock split, which took effect for trading on a split-adjusted basis. This corporate action doubled the total outstanding share count while proportionally lowering the nominal per-share price, making the equity more accessible to a broader range of retail and institutional market participants. Stock splits often act as psychological and liquidity catalysts, triggering increased trading volume and heightened market interest as investors adjust portfolios around the effective distribution date.
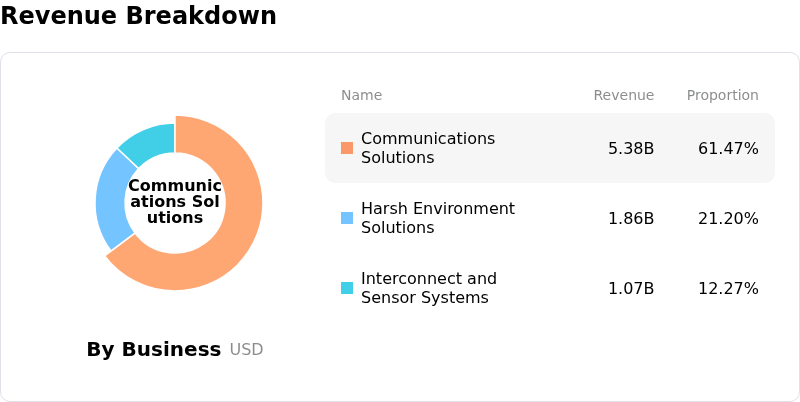
Beyond corporate action mechanics, Amphenol continues to demonstrate strong fundamental momentum underpinned by robust financial performance. The company recently delivered record quarterly results, driven by massive demand across its Communications Solutions segment. As hyperscalers and enterprise clients expand data center capabilities, Amphenol's high-speed interconnects, fiber-optic connectors, and sensor systems have seen accelerated adoption in artificial intelligence applications. Furthermore, the strategic integration of CommScope's Connectivity and Cable Solutions business has outperformed initial projections, providing substantial revenue accretion and operational synergies.
Positive Wall Street sentiment and upward analyst revisions have further bolstered investor confidence. Management's strong forward guidance reflects sustained multi-industry demand across defense, commercial aerospace, and automotive markets, alongside communications infrastructure. While a stock split inherently leaves underlying enterprise valuation unchanged, the convergence of improved trading liquidity, dominant positioning in AI infrastructure supply chains, and superior earnings execution continues to support strong institutional demand for the shares.
Technical Analysis of Amphenol Corp (APH)
Technically, Amphenol Corp (APH) shows a MACD (12,26,9) value of -0.091, indicating a neutral signal. The RSI at 51.974 suggests neutral condition and the Williams %R at 47.811 suggests neutral condition. Please monitor closely.
Media Coverage of Amphenol Corp (APH)
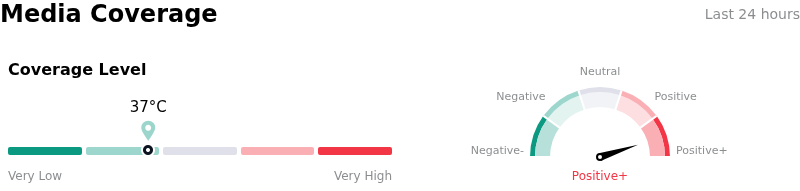
In terms of media coverage, Amphenol Corp (APH) shows a coverage score of 37, indicating a low level of media attention. The overall market sentiment index is currently in extremely bullish zone.
Fundamental Analysis of Amphenol Corp (APH)
Amphenol Corp (APH) is in the Technology Equipment industry. Its latest annual revenue is $23.09B, ranking 4 in the industry. The net profit is $4.27B, ranking 1 in the industry. Company Profile
Over the past month, multiple analysts have rated the company as Buy, with an average price target of $197.22, a high of $230.00, and a low of $170.00.
More details about Amphenol Corp (APH)
Company Specific Risks:
- Stretched Premium Valuation: Amphenol trades at an elevated price-to-earnings ratio above 40x, representing a steep premium over the electronic equipment industry median and making the share price acutely sensitive to valuation compression during market pullbacks.
- Substantial Insider Share Liquidation: Recent market tracking highlights heavy insider selling activity, with company executives offloading over one million shares worth approximately $172 million, fueling institutional caution regarding valuation ceilings.
- Treasury Yield Pressure on High-Multiple Tech: Broader macroeconomic volatility and spiking benchmark Treasury yields near 4.8% to 5.0% are driving capital rotation out of high-multiple hardware and component stocks, amplifying intraday downward pressure.
- Hyperscaler CapEx Concentration and Integration Risk: Financial performance is increasingly concentrated in AI datacenter buildouts and reliant on aggressive bolt-on acquisition integrations, leaving operating margins exposed if hyperscaler capital expenditures slow or integration friction arises.
Recommended Articles


