


Corn Futures (CORN-F) Is down 2.03% on Sep 3: Is the Market Repricing It?
Corn Futures (CORN-F) is down 2.03% at Sep 3 05:50(ET), now at $530.51, with a 7-day up of 4.63%.
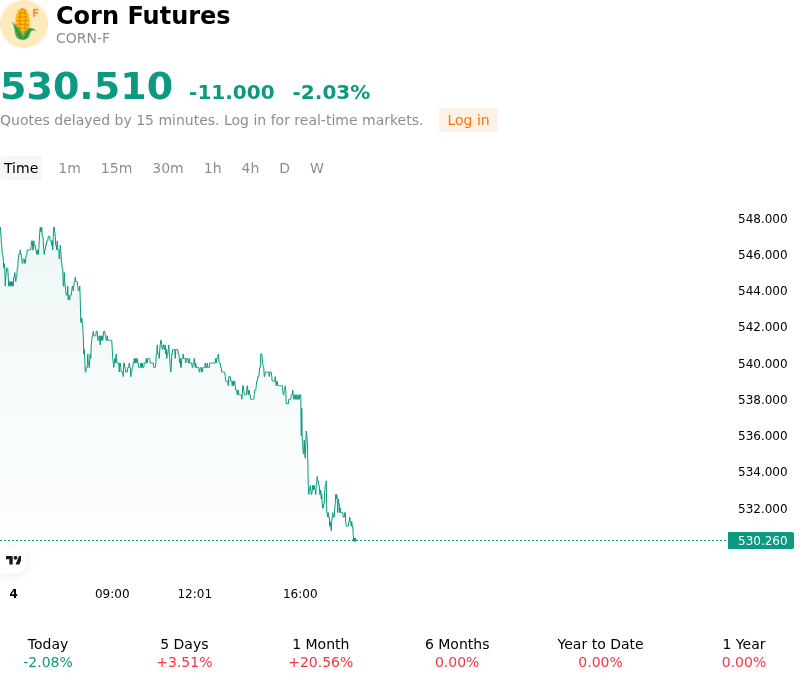
What is driving Corn Futures (CORN-F)’s stock price down today?
Corn futures experienced a pullback as market participants engaged in profit-taking following a multi-week rally that carried prices to contract highs. Technical momentum indicators had reached overbought territory after sustained buying through late summer, driven by downward revisions to yield expectations and elevated heat across the U.S. Midwest. As prices tested key resistance levels, institutional investors and momentum funds executed systematic long liquidation, while expanding commercial hedge pressure from agricultural producers seeking to lock in elevated pricing further pressured the market.
From a fundamental perspective, the seasonal transition into harvest is beginning to weigh on prompt pricing dynamics. Early field work in portions of the Corn Belt and Southern growing regions is increasing the physical availability of new-crop grain, prompting elevators to adjust cash basis levels lower and driving increased selling from farmers facing storage constraints. Although weekly crop condition ratings remain significantly lower than last year, the immediate influx of physical grain and position-squaring ahead of upcoming monthly USDA supply-and-demand reports led traders to temporarily discount near-term supply tightness.
Despite the session's weakness, institutional strategists generally view the movement as an event-driven technical correction within a broader structural repricing. Macro drivers, including global feed grain demand, ethanol production margins, energy market fluctuations, and ongoing trade flow disruptions out of key export regions, continue to provide an underlying floor. Market participants will remain focused on upcoming field yield survey updates, early harvest yield reports, and export sales cadence to gauge whether the supply balance will tighten further into the final months of the calendar year.
Technical Analysis of Corn Futures (CORN-F)
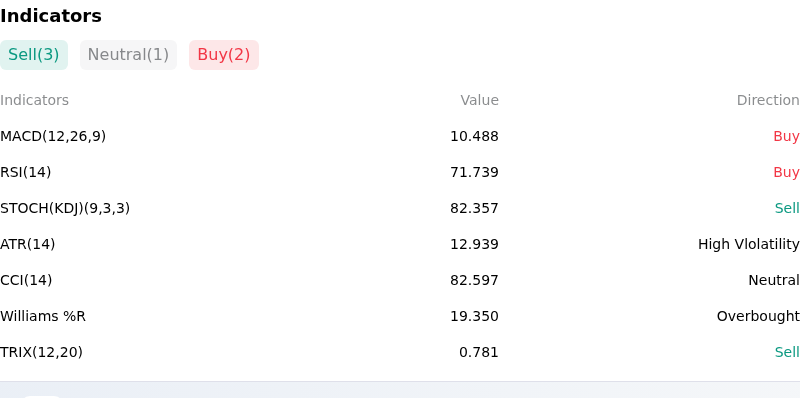
Technically, Corn Futures (CORN-F) shows a MACD (12,26,9) value of 10.488, indicating a buy signal. The RSI at 71.739 suggests buy condition and the Williams %R at 19.350 suggests overbought condition. Please monitor closely.
More details about Corn Futures (CORN-F)
Recent Events and Risks:
- Overbought Technical Unwind and Profit-Taking: Following a massive counter-seasonal August surge of nearly 16% that pushed December corn futures to three-year highs above $5.20 per bushel, prices suffered sharp intraday declines as traders aggressively locked in profits and overbought momentum indicators triggered technical selling.
- Seasonal Harvest Supply Pressure: As the U.S. Corn Belt crop rapidly enters harvest stage—with crop development running ahead of multi-year averages—the immediate influx of physical grain into country elevators and river terminals is generating typical seasonal cash market pressure and capping near-term futures upside.
- Pre-WASDE Position Squaring: Speculators and institutional funds are paring back long exposure ahead of the upcoming September USDA WASDE report to mitigate downside risk, amidst uncertainty over whether final government yield estimates will align closer to original baseline projections rather than lower private survey figures.
- Demand Rationing and Export Sluggishness: Corn prices holding near multi-year highs are threatening to ration consumption among domestic livestock feeders and ethanol processors, while recent weak export inspection numbers and spot buying fatigue from major international importers heighten demand-side vulnerability.
Recommended Articles


