


Sugar (SUGAR) Volatility Intensified on Sep 3: What to Watch
Sugar (SUGAR) is down 2.02% at Sep 3 04:55(ET), now at $0.1892, with a 7-day up of 0.91%.
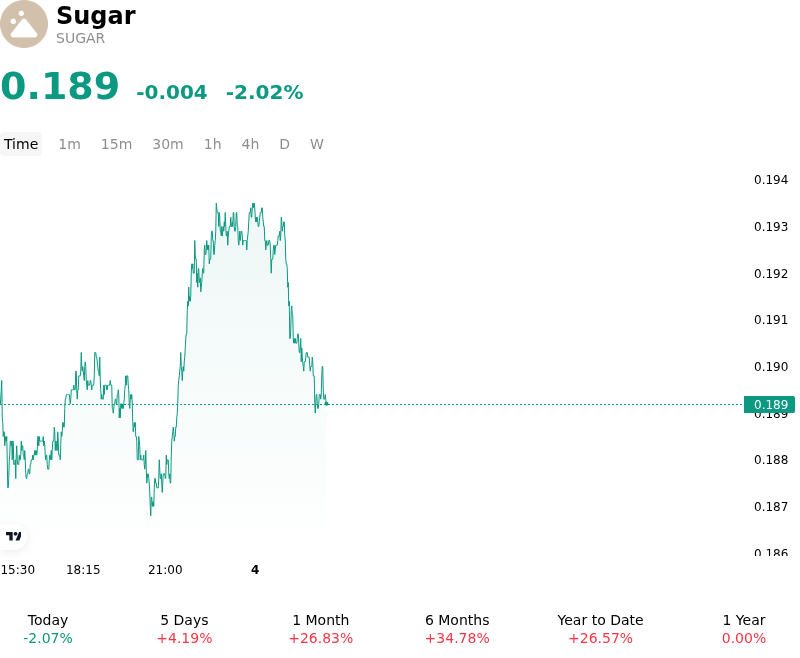
What is driving Sugar (SUGAR)’s stock price down today?
Sugar futures experienced a downward pull as short-term profit-taking, long liquidation, and government interventions in key consuming nations countered the broader structural supply concerns that had pushed prices to multi-month highs. After reaching multi-month peaks fueled by projections of a global production deficit for the upcoming crop season, speculative traders took profits, prompting a technical retracement.
A primary catalyst for the easing pressure came from regulatory measures and supply assurances in India, the world’s largest sugar consumer. Domestic industry associations reassured markets that inventory levels remain sufficient to satisfy upcoming peak seasonal demand, supported by plans to advance the crushing schedule in key growing regions. Concurrently, government authorities implemented stricter stockholding limits for trade intermediaries and introduced short-duration quota releases to prevent hoarding and curb speculative price escalation. These administrative actions effectively moderated near-term spot price expectations and tempered international buying urgency.
On the supply side, market participants closely evaluated harvest progress in Brazil’s Center-South, the world’s leading exporter. While recent rainfall disrupted field operations, expectations for an eventual recovery in cane sugar content during the remainder of the crushing season encouraged producer hedging. Fluctuations in the Brazilian real also incentivized localized forward sales by Brazilian sugar mills seeking to lock in export revenues.
Furthermore, positioning dynamics played a notable role in driving the retreat. Institutional capital flows showed evidence of long liquidation following an extended rally in raw and white sugar contracts. The market’s heavy fund positioning left prices vulnerable to downside adjustments when bullish momentum slowed near critical technical resistance.
Despite the pullback, the underlying supply-demand balance remains constrained by longer-term structural factors. Global trade flows continue to face headwinds from reduced output expectations in Europe and lingering weather uncertainties tied to El Niño patterns in Southeast Asia and South America. However, for the current session, the convergence of government market intervention in Asia, technical profit-taking, and producer hedging activity dominated trading sentiment and drove prices lower.
Technical Analysis of Sugar (SUGAR)
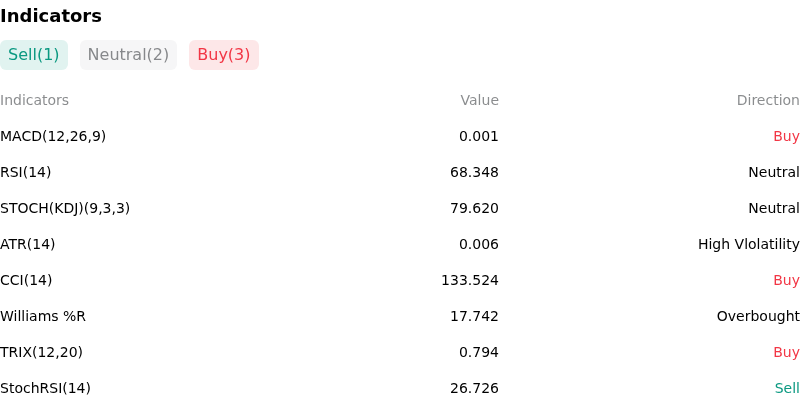
Technically, Sugar (SUGAR) shows a MACD (12,26,9) value of 0.001, indicating a buy signal. The RSI at 68.348 suggests neutral condition and the Williams %R at 17.742 suggests overbought condition. Please monitor closely.
More details about Sugar (SUGAR)
Recent Events and Risks:
- Sucrose Recovery in Brazil's Center-South Crush: Recent market analysis from Goldman Sachs highlights a near-term downside risk from improving sugarcane sucrose (ATR) content and crushing momentum in Brazil's Center-South region, where moderating rainfall is expanding physical export availability.
- Speculative Overextension and Long Liquidation Risk: Market positioning data shows funds holding near-record net-long positions in ICE London white sugar futures alongside elevated long exposure in NY raw sugar, creating heightened vulnerability to sharp intraday sell-offs driven by technical profit-taking and forced unwinds.
- Indian Production Rebound and Export Policy Uncertainty: Forecasts projecting a potential 12% year-over-year surge in Indian 2026/27 sugar production due to late-monsoon recovery and higher acreage raise market concerns that any eventual relaxation of government export restrictions could trigger an influx of supply into world markets.
- Mix Shift Risks Toward Sugar Production in Brazil: Potential weakness in Brazilian domestic ethanol pricing relative to raw sugar benchmarks risks incentivizing Center-South millers to maximize sugar allocation over biofuel production, threatening to release additional physical volume into global trade channels.
Recommended Articles


