


Fortinet Inc Stock (FTNT) Moved Down by 5.25% on Sep 2: Key Drivers Unveiled
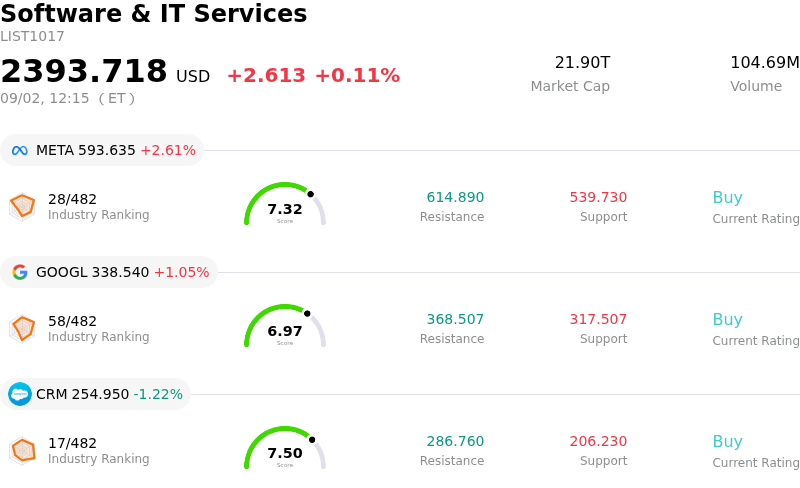
Fortinet Inc (FTNT) moved down by 5.25%. The Software & IT Services sector is up by 0.11%. The company underperformed the industry. Top 3 stocks by turnover in the sector: Meta Platforms Inc (META) up 2.57%; Alphabet Inc Class A (GOOGL) up 1.00%; Salesforce Inc (CRM) down 1.22%.
What is driving Fortinet Inc (FTNT)’s stock price down today?
Fortinet experienced selling pressure primarily driven by sector-wide weakness across the cybersecurity and software infrastructure space. A key catalyst for the broader pullback was peer Palo Alto Networks reporting its quarterly financial results, where despite a solid revenue beat, key growth metrics such as Next-Generation Security Annual Recurring Revenue failed to hit the elevated threshold required to sustain its premium valuation. This disappointed growth-oriented investors and sparked a valuation repricing across cybersecurity peers, pulling Fortinet down in sympathy along with other major network security providers.
Prior to this retreat, Fortinet had enjoyed a powerful multi-month rally driven by stellar quarterly financial results, accelerating demand for AI-driven security workloads, and an upgraded full-year revenue and earnings outlook. However, that extended run pushed the stock's forward valuation metrics well above historical averages and broader technology sector benchmarks. With shares trading at a substantial premium, institutional investors seized the shift in industry sentiment to lock in profits. Recent filings showing insider share sales also contributed to cautious trading behavior among market participants.
From a technical analysis perspective, the downward move broke through key short-term support levels, including the stock's 20-day and 50-day moving averages. Crossing below these technical thresholds triggered automated momentum selling and stop-loss executions, accelerating intraday downside momentum. Despite the short-term pullback, Fortinet maintains solid underlying fundamentals, supported by record operating margins, strong free cash flow generation, and expanding market share in unified SASE and operational technology security. Institutional investors will watch closely for stabilizing price action around key technical support zones as sector-wide valuation pressures settle.
Technical Analysis of Fortinet Inc (FTNT)
Technically, Fortinet Inc (FTNT) shows a MACD (12,26,9) value of 0.032, indicating a buy signal. The RSI at 45.304 suggests neutral condition and the Williams %R at 81.377 suggests oversold condition. Please monitor closely.
Media Coverage of Fortinet Inc (FTNT)
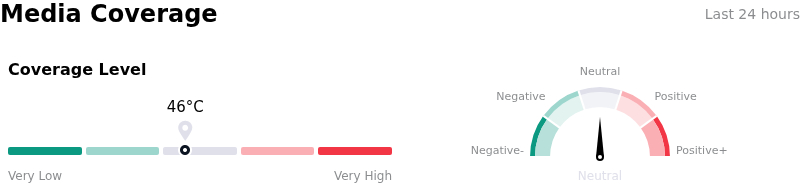
In terms of media coverage, Fortinet Inc (FTNT) shows a coverage score of 46, indicating a moderate level of media attention. The overall market sentiment index is currently in neutral zone.
Fundamental Analysis of Fortinet Inc (FTNT)
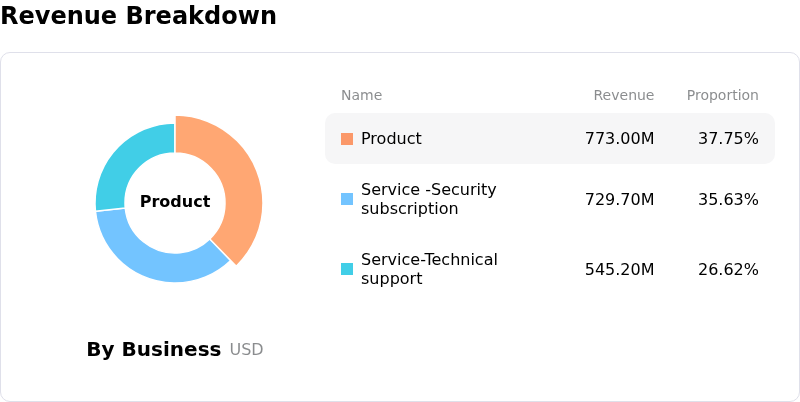
Fortinet Inc (FTNT) is in the Software & IT Services industry. Its latest annual revenue is $6.80B, ranking 49 in the industry. The net profit is $1.85B, ranking 29 in the industry. Company Profile
Over the past month, multiple analysts have rated the company as Hold, with an average price target of $161.79, a high of $220.00, and a low of $99.00.
More details about Fortinet Inc (FTNT)
Company Specific Risks:
- Valuation Compression and Profit-Taking Volatility: Following an intraday decline of over 5% from all-time highs of $173.89 down into the $154–$161 range, FTNT trades at an elevated forward P/E multiple above 50x—well above the consensus analyst price target of $150.91—leaving the stock highly vulnerable to persistent multiple contraction and profit-taking.
- Post-Refresh Hardware Growth Cliff: Analyst commentary highlights operational risk that the massive surge in FortiGate firewall upgrade cycles faces an impending growth cliff in late 2026 as enterprise customer inventory digestion completes, potentially dampening future billings momentum.
- Substantial Executive Insider Selling: Recent disclosure tracking reveals that corporate insiders have sold over $126.8 million worth of shares over the past 12 months with zero insider purchases, signaling executive caution regarding stock price sustainability at current levels.
- Operating Margin Compression: Management's third-quarter non-GAAP operating margin guidance of 35% to 37% reflects sequential margin compression from Q2's 38% level, raising concern over negative operating leverage if operating expenses grow faster than revenue.
Recommended Articles


