


Fortinet Inc Stock (FTNT) Moved Down by 5.52% on Sep 1: Facts Behind the Movement
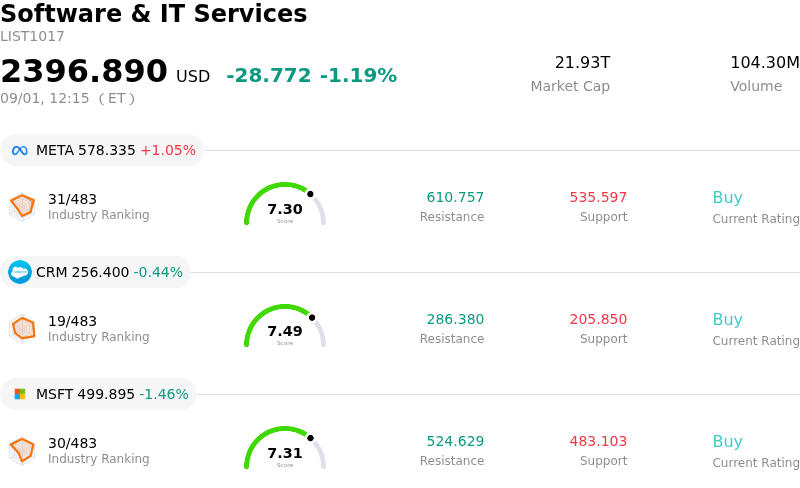
Fortinet Inc (FTNT) moved down by 5.52%. The Software & IT Services sector is down by 1.19%. The company underperformed the industry. Top 3 stocks by turnover in the sector: Meta Platforms Inc (META) up 1.05%; Salesforce Inc (CRM) down 0.43%; Microsoft Corp (MSFT) down 1.46%.
What is driving Fortinet Inc (FTNT)’s stock price down today?
Fortinet experienced a notable pull-back accompanied by heightened intraday volatility as short-term profit-taking accelerated following an extended, record-setting rally. The sell-off follows a powerful late-August surge that drove the cybersecurity leader to fresh all-time highs, propelled by broad sector tailwinds, Federal CMMC Level 2 certification news, and upgraded full-year financial guidance. After such a dramatic multi-week run-up, overbought technical indicators and momentum fatigue triggered institutional profit-taking across enterprise software holdings.
The downward pressure largely reflects valuation reassessments rather than structural operational failures. Following its rapid advance, Fortinet's trading price rose to a significant premium relative to intrinsic discounted cash flow models and average Wall Street consensus price targets. With sell-side consensus ratings remaining predominantly neutral and recent insider transaction disclosures by senior leadership lingering in investor memory, market participants utilized the recent peak to rebalance portfolios, questioning whether market valuation had stretched beyond immediate fundamental justification.
Underpinning current market sentiment is an ongoing strategic debate regarding the long-term sustainability of the enterprise hardware refresh cycle versus high-margin recurring subscription attach rates. While management recently boosted full-year guidance backed by strong product revenue growth and strategic AI cybersecurity acquisitions, institutional investors remain sensitive to the pace at which hardware momentum translates into predictable recurring cash flows. Until valuation multiples realign with consensus expectations, the equity remains subject to sector rotation and intraday volatility despite solid underlying cybersecurity demand.
Technical Analysis of Fortinet Inc (FTNT)
Technically, Fortinet Inc (FTNT) shows a MACD (12,26,9) value of 1.658, indicating a buy signal. The RSI at 51.803 suggests neutral condition and the Williams %R at 48.264 suggests neutral condition. Please monitor closely.
Media Coverage of Fortinet Inc (FTNT)
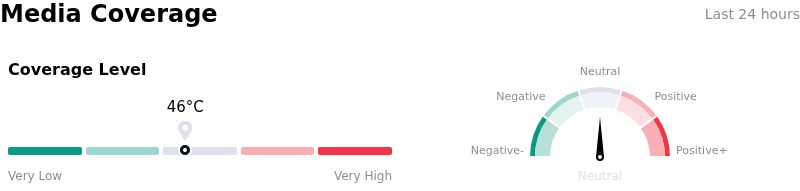
In terms of media coverage, Fortinet Inc (FTNT) shows a coverage score of 46, indicating a moderate level of media attention. The overall market sentiment index is currently in neutral zone.
Fundamental Analysis of Fortinet Inc (FTNT)
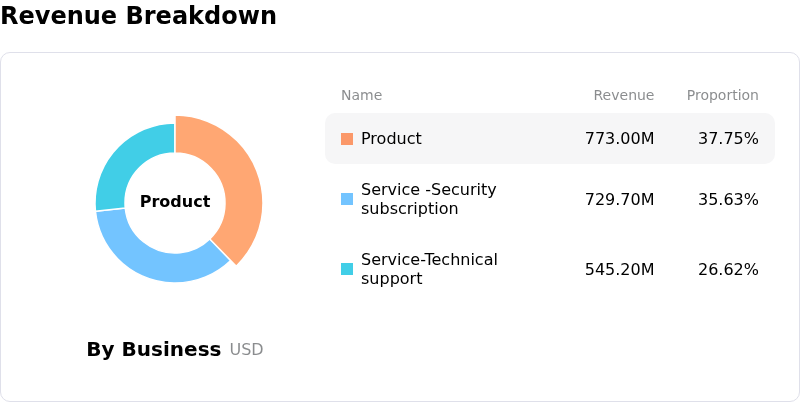
Fortinet Inc (FTNT) is in the Software & IT Services industry. Its latest annual revenue is $6.80B, ranking 49 in the industry. The net profit is $1.85B, ranking 29 in the industry. Company Profile
Over the past month, multiple analysts have rated the company as Hold, with an average price target of $159.88, a high of $220.00, and a low of $86.00.
More details about Fortinet Inc (FTNT)
Company Specific Risks:
- Valuation Premium and Technical Overhead: Trading at an elevated price-to-earnings ratio near 60x and above consensus fair value targets, the stock faces heightened downside sensitivity, with short-term technical oscillator divergence driving profit taking and intraday pullbacks.
- Operating Margin Compression Concerns: Management's projected non-GAAP operating margins signal potential negative operating leverage compared to peak quarters, constrained by rising memory component costs, foreign exchange headwinds, and increased cloud investments.
- Execution Risks in SASE Transition: Accelerating the strategic pivot from traditional hardware firewalls to recurring Unified SASE cloud solutions exposes the company to intense competition from pure-play rivals like Zscaler and Palo Alto Networks, creating uncertainty around market share retention once the firewall refresh cycle slows.
- Executive Insider Sales Signals: Persistent open-market sales by corporate executives and the adoption of Rule 10b5-1 trading plans by senior management without matching insider purchases have heightened governance concerns near all-time highs.
Recommended Articles


