


Aon PLC Stock (AON) Moved Down by 7.19% on Aug 31: Facts Behind the Movement
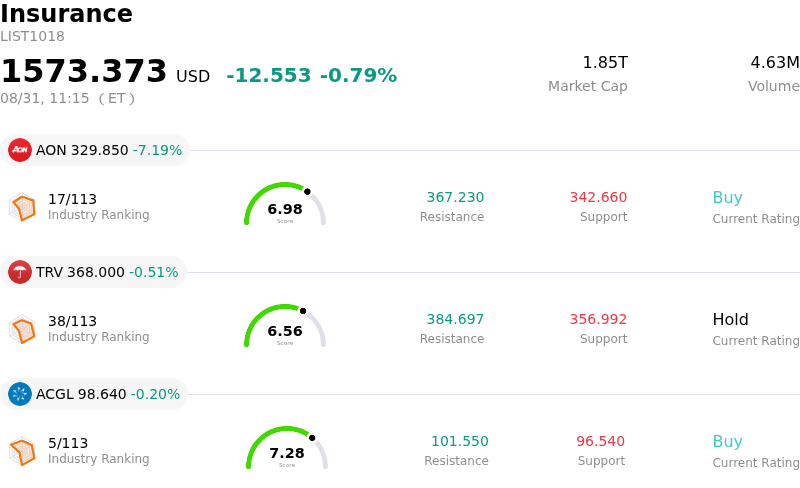
Aon PLC (AON) moved down by 7.19%. The Insurance sector is down by 0.79%. The company underperformed the industry. Top 3 stocks by turnover in the sector: Aon PLC (AON) down 7.19%; Travelers Companies Inc (TRV) down 0.51%; Arch Capital Group Ltd (ACGL) down 0.20%.
What is driving Aon PLC (AON)’s stock price down today?
Aon plc experienced notable downward pressure during the trading session following the major announcement that it has entered into a definitive agreement to acquire USI Advantage Corp. from KKR and other shareholders for seventeen billion dollars in cash. While the acquisition significantly expands Aon’s middle-market platform and presence in the high-growth Excess and Surplus commercial insurance market, investors reacted negatively to the transaction's financing structure and leverage implications. Aon plans to finance the entire cash consideration through new debt issuances, elevating its pro-forma leverage ratio well above its target range.
Market sentiment was further weighed down by the heavy near-term cost burden and temporary capital allocation shifts associated with the deal. Management outlined up to one point one billion dollars in combined transaction, integration, and retention expenses over the coming years. Furthermore, to maintain investment-grade credit ratings and prioritize deleveraging over the next two years, Aon announced a temporary suspension of its share repurchase program. The prospective delay in adjusted earnings per share accretion, which is not projected toAlias meaningfully materialize until 2028, heightened investor impatience regarding near-term financial flexibility.
From an operational perspective, the deal strengthens Aon's long-term competitive positioning in U.S. middle-market property and casualty brokering and employee benefits. However, institutional investors expressed caution regarding potential execution and integration risks, especially given the ongoing integration of prior large-scale mid-market acquisitions. Until management demonstrates tangible progress in cost synergy realization, debt reduction, and leverage normalization, the market is likely to maintain a cautious stance on the stock despite its strong underlying core business fundamentals.
Technical Analysis of Aon PLC (AON)
Technically, Aon PLC (AON) shows a MACD (12,26,9) value of -3.685, indicating a sell signal. The RSI at 34.789 suggests neutral condition and the Williams %R at 97.705 suggests oversold condition. Please monitor closely.
Media Coverage of Aon PLC (AON)
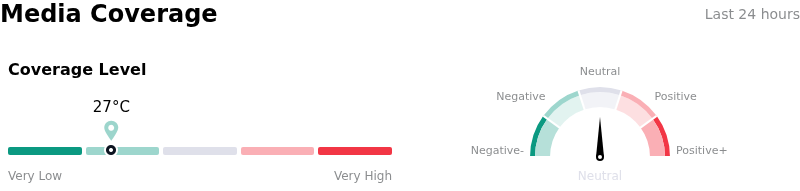
In terms of media coverage, Aon PLC (AON) shows a coverage score of 27, indicating a low level of media attention. The overall market sentiment index is currently in neutral zone.
Fundamental Analysis of Aon PLC (AON)
Aon PLC (AON) is in the Insurance industry. Its latest annual revenue is $17.18B, ranking 19 in the industry. The net profit is $3.69B, ranking 11 in the industry. Company Profile
Over the past month, multiple analysts have rated the company as Buy, with an average price target of $403.25, a high of $445.00, and a low of $339.00.
More details about Aon PLC (AON)
Company Specific Risks:
- Debt-Financed $17 Billion USI Acquisition: Aon announced a definitive agreement to acquire USI Insurance Services for $17.0 billion in an all-cash deal funded entirely by debt, spiking pro-forma leverage to 4.8x versus its long-term target of 2.8x–3.0x and triggering immediate intraday stock pressure.
- High Deal Costs and Integration Risk: The company projects up to $1.11 billion in transaction, integration, and employee retention expenses, creating margin friction and execution overlap while still integrating its major 2024 NFP platform acquisition.
- Executive Governance and Leadership Turnover: Following the recent resignation of Chief Financial Officer Edmund Reese and the appointment of an interim finance chief, management stability remains under scrutiny as the leadership team attempts to navigate complex M&A debt structuring and integration.
- Softer Commercial Pricing and Earnings Downgrades: Wall Street analysts trimmed full-year and Q3 earnings projections due to deceleration in organic revenue growth, client retention headwinds, and softening property and casualty insurance premium rates.
Recommended Articles


