


BNB (BNBUSD) Volatility Intensified on Aug 31: What You Should Know
BNB (BNBUSD) is down 1.96% at Aug 31 00:15(ET), now at $682, with a 7-day down of 2.74%.
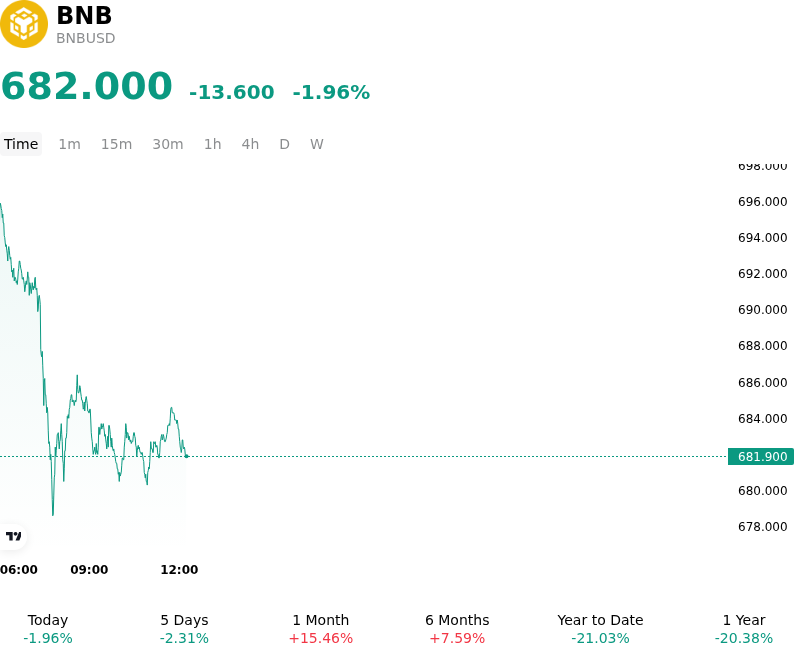
What is driving BNB (BNBUSD)’s stock price down today?
The downward trajectory in BNB reflects a combination of technical rejection at key overhead resistance and leverage-driven long liquidations across derivatives venues. After attempting to consolidate near key psychological thresholds above seven hundred dollars, selling pressure intensified near upper resistance bands, triggering a sharp pullback. The failure to sustain upside momentum prompted tactical profit-taking among short-term market participants, disrupting the recent bullish structure. As spot prices slipped below immediate support, automated risk-management parameters across perpetual futures markets executed forced liquidations of overleveraged long positions. This liquidation cascade injected concentrated sell-side liquidity into the market, accelerating the intraday decline as open interest contracted across major derivatives exchanges.
The pull-back in BNB also coincided with broader digital asset market consolidation ahead of September, driven by defensive positioning across macro-sensitive market participants. Following hawkish monetary policy signals and sticky Treasury yields, institutional risk appetite cooled slightly across high-beta digital assets. With derivatives traders actively managing risk exposure around upcoming monthly options expirations, capital flows shifted toward capital preservation rather than aggressive accumulation. While institutional ETF flows into major crypto benchmarks showed mixed activity, capital rotation into utility-focused Layer-1 assets like BNB paused, leaving the market susceptible to leverage unwinding during periods of lower spot liquidity.
Despite immediate price headwinds, structural fundamentals within the underlying BNB Chain ecosystem remain supportive. Recent protocol enhancements, including the successful implementation of the Pasteur hard fork to optimize cross-chain verification and transaction capacity, continue to enhance network utility. Furthermore, on-chain data underscores expanding activity in decentralized finance and tokenized assets across the network. However, short-term price action remains constrained by derivatives positioning, profit-taking following multi-week gains, and broader macro liquidity constraints. Investors continue to monitor global monetary policy expectations, regulatory developments surrounding exchange-linked assets, and system-wide leverage levels to evaluate whether current price adjustments represent a routine positioning reset or a prolonged period of consolidation.
Technical Analysis of BNB (BNBUSD)
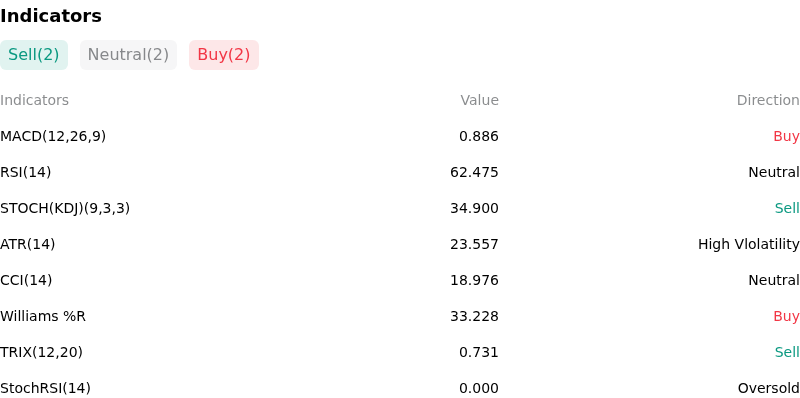
Technically, BNB (BNBUSD) shows a MACD (12,26,9) value of 0.950, indicating a buy signal. The RSI at 62.712 suggests neutral condition and the Williams %R at 32.831 suggests buy condition. Please monitor closely.
More details about BNB (BNBUSD)
Recent Events and Risks:
- European Union Regulatory Scrutiny: Ongoing compliance challenges stemming from Binance's failure to secure full Markets in Crypto-Assets (MiCA) licensing across key European jurisdictions have intensified, with reports of unauthorized client onboarding raising the threat of enforcement penalties, service restrictions, and dampened regional trading activity.
- Exchange Transaction Restrictions & Liquidity Friction: The multi-phase enforcement of transaction bans against 16 third-party crypto platforms to align with international sanctions has introduced operational friction across inter-exchange settlement routes, risking localized liquidity fragmentation and reduced transactional velocity for BNB.
- Derivatives Leverage & Downside Liquidation Exposure: High concentration of leveraged long positions clustered around the $680–$685 support range leaves BNB vulnerable to cascading stop-losses and automated forced liquidations if selling pressure forces a breakdown below key technical levels.
- Macroeconomic Risk-Off Sentiment: Diminished expectations for aggressive Federal Reserve rate cuts have spurred profit-taking across speculative crypto assets, creating dip-buying exhaustion and leaving exchange utility tokens like BNB exposed to broader altcoin capital outflows.
Recommended Articles


