


Solana (SOLUSD) Volatility Intensified on Aug 30: What You Should Know
Solana (SOLUSD) is up 1.07% at Aug 30 09:25(ET), now at $105.35, with a 7-day up of 11.99%.
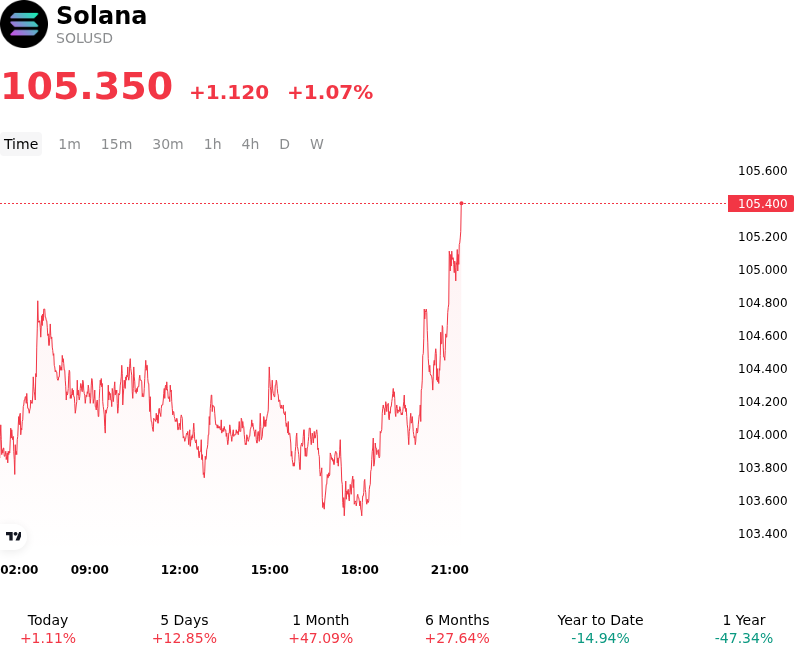
What is driving Solana (SOLUSD)’s stock price up today?
Capital inflows into Solana reflected growing institutional participation and positive re-rating of the asset's underlying tokenomics following major ecosystem milestones. Institutional demand via spot Solana exchange-traded products remained a primary driver of sustained net buying, highlighted by cumulative fund inflows hitting record totals and validating SOL within regulated asset management frameworks. Concurrently, investor sentiment was bolstered by the passage of landmark governance proposals designed to accelerate emission disinflation and increase protocol fee burn rates. This structural tightening of projected long-term supply expectations enhanced SOL's valuation narrative, attracting both strategic institutional allocations and thematic capital flows.
Solana's fundamental growth metrics further supported risk appetite, as record transaction throughput and elevated decentralized application activity reinforced confidence in the network's scalability. Recent technical performance upgrades, including client improvements that reduced target slot times and expanded block compute limits, demonstrated operational resilience under heavy execution loads. The expansion of ecosystem liquidity—driven by strong stablecoin circulation and active decentralized exchange volume—provided fundamental support for execution quality, encouraging spot market accumulation.
From a technical and market structure perspective, SOL's push above key psychological and long-term moving average resistance levels triggered momentum-driven buying and derivative short-covering activity. While broader digital asset markets continued to digest macroeconomic policy commentary from Federal Reserve officials and shifting interest rate expectations, Solana demonstrated relative strength. The convergence of steady ETF liquidity, improving tokenomic scarcity models, and robust network usage enabled capital to absorb macro uncertainty and maintain positive positioning.
Technical Analysis of Solana (SOLUSD)
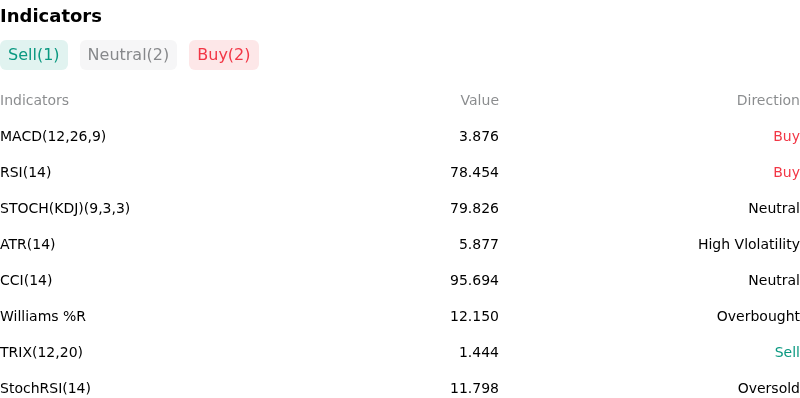
Technically, Solana (SOLUSD) shows a MACD (12,26,9) value of 3.876, indicating a buy signal. The RSI at 78.454 suggests buy condition and the Williams %R at 12.150 suggests overbought condition. Please monitor closely.
More details about Solana (SOLUSD)
Recent Events and Risks:
- Overbought Resistance Rejection and Liquidation Risk: Following a rapid rally testing multi-month resistance near $102–$109, SOL encountered sharp intraday rejections while the daily Relative Strength Index (RSI) pushed to overbought levels near 79. With futures open interest elevated at approximately $6.26 billion, failure to hold immediate support around $93.75–$95 risks triggering a wave of forced long position liquidations.
- Historical ETF Inflow Reversal Pattern: Despite spot Solana ETFs recording strong daily net inflows exceeding $60 million, institutional analysts warn of a recurring market pattern where previous record ETF inflow spikes were followed by sharp price distribution, creating sell-the-news pressure near psychological resistance.
- DeFi Ecosystem Security Exploits: A security exploit targeting Solana-based neobank protocol Avici resulted in over $600,000 drained from user balances due to smart contract vulnerabilities, highlighting ongoing operational security risks and third-party contract vulnerabilities across the Solana DeFi ecosystem.
- Post-Governance Catalyst Exhaustion: Speculative buying tied to validator governance votes on supply disinflation and fee burn mechanics (SGP-0002 and SGP-0003) is beginning to wane. Because structural protocol updates will take months to physically alter circulating token supply, traders express concern over catalyst exhaustion and near-term fundamental pullbacks.
Recommended Articles


