


ServiceNow Inc Stock (NOW) Moved Up by 4.37% on Aug 28: Drivers Behind the Movement
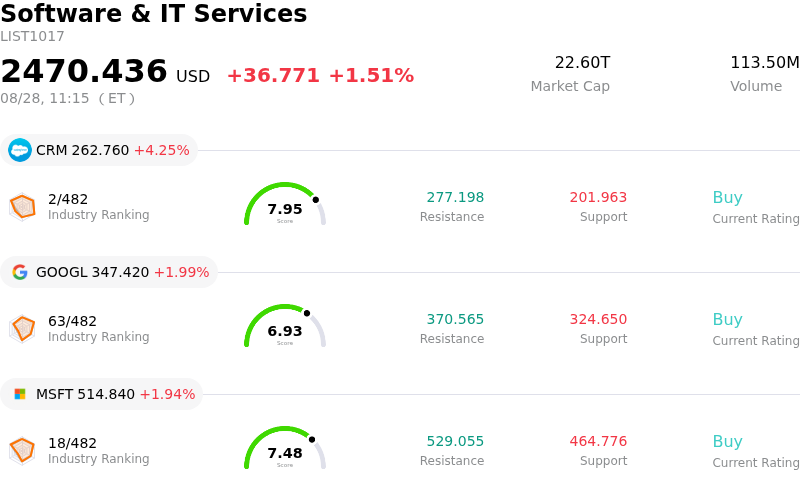
ServiceNow Inc (NOW) moved up by 4.37%. The Software & IT Services sector is up by 1.51%. The company outperformed the industry. Top 3 stocks by turnover in the sector: Salesforce Inc (CRM) up 4.20%; Alphabet Inc Class A (GOOGL) up 1.98%; Microsoft Corp (MSFT) up 1.94%.
What is driving ServiceNow Inc (NOW)’s stock price up today?
ServiceNow experienced positive momentum as a sector-wide re-rating in enterprise software lifted sentiment across high-growth cloud and software platform providers. Positive earnings read-throughs from industry peers and management commentary across the software landscape helped alleviate persistent concerns surrounding potential enterprise software disruption from artificial intelligence. Institutional investors have increasingly viewed ServiceNow as a primary beneficiary rather than a victim of AI adoption, triggering renewed capital inflows into high-quality software names.
Underpinning this upward trajectory is ServiceNow’s fundamental progress in monetizing enterprise AI. The company recently highlighted rapid acceleration in its AI annual contract value and a surge in agentic AI deployments across enterprise workflows. Strong growth in remaining performance obligations and multi-million-dollar contract wins demonstrate robust customer retention and expanding enterprise footprint. Additionally, recent strategic partnerships with global technology service providers and hardware leaders continue to enhance deployment capabilities and long-term enterprise integration.
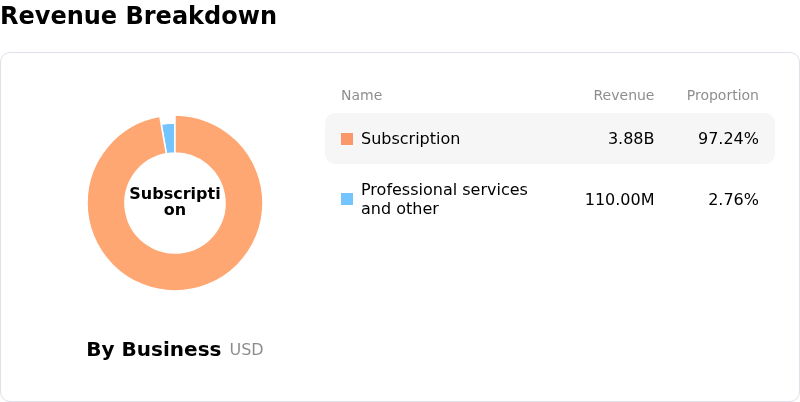
Positive analyst sentiment has further reinforced market confidence. Major Wall Street brokerages have recently raised target prices and reiterated outperform ratings, emphasizing ServiceNow's strong subscription revenue trajectory and margin expansion potential. Although the software sector has navigated valuation recalibrations over past quarters, the company’s ability to combine top-line growth with internal AI efficiencies positions it well within institutional portfolios as enterprise software spending stabilizes.
Technical Analysis of ServiceNow Inc (NOW)
Technically, ServiceNow Inc (NOW) shows a MACD (12,26,9) value of 2.323, indicating a buy signal. The RSI at 72.654 suggests buy condition and the Williams %R at 1.172 suggests overbought condition. Please monitor closely.
Media Coverage of ServiceNow Inc (NOW)
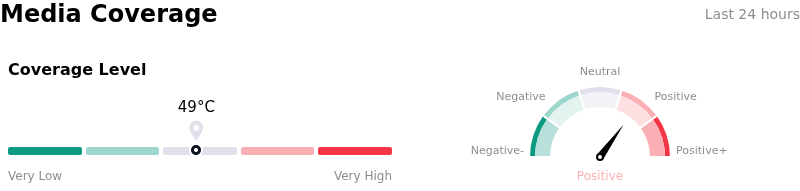
In terms of media coverage, ServiceNow Inc (NOW) shows a coverage score of 49, indicating a moderate level of media attention. The overall market sentiment index is currently in bullish zone.
Fundamental Analysis of ServiceNow Inc (NOW)
ServiceNow Inc (NOW) is in the Software & IT Services industry. Its latest annual revenue is $13.28B, ranking 28 in the industry. The net profit is $1.75B, ranking 30 in the industry. Company Profile
Over the past month, multiple analysts have rated the company as Buy, with an average price target of $145.89, a high of $248.00, and a low of $72.00.
More details about ServiceNow Inc (NOW)
Company Specific Risks:
- Elevated Valuation Multiples and Profit-Taking Volatility: ServiceNow continues to trade at high valuation multiples, including a trailing price-to-earnings ratio near 80x, leaving the stock exceptionally vulnerable to intraday sell-offs and sharp profit-taking whenever broader software momentum cools.
- Threat of AI-Driven SaaS Business Model Disruption: The rapid market introduction of autonomous AI agents—such as OpenAI's Presence and competing enterprise automation tools—threatens ServiceNow's traditional per-seat licensing model, as automated workflow resolution reduces the reliance on human user seats.
- Margin Pressure from Accelerated AI Infrastructure Spending: Intensive capital deployment toward proprietary AI platforms, large language model integrations, and cybersecurity capabilities is driving up operational costs, creating margin compression risks if enterprise software budgets pull back on core workflow renewals.
- Persistent Executive Insider Share Sales: Recent SEC filings reveal ongoing share liquidations by corporate directors and executive management following stock-based compensation vesting, creating technical headwinds and signaling caution during intraday price swings.
Recommended Articles


