


ServiceNow Inc Stock (NOW) Moved Up by 8.96% on Aug 27: Facts Behind the Movement
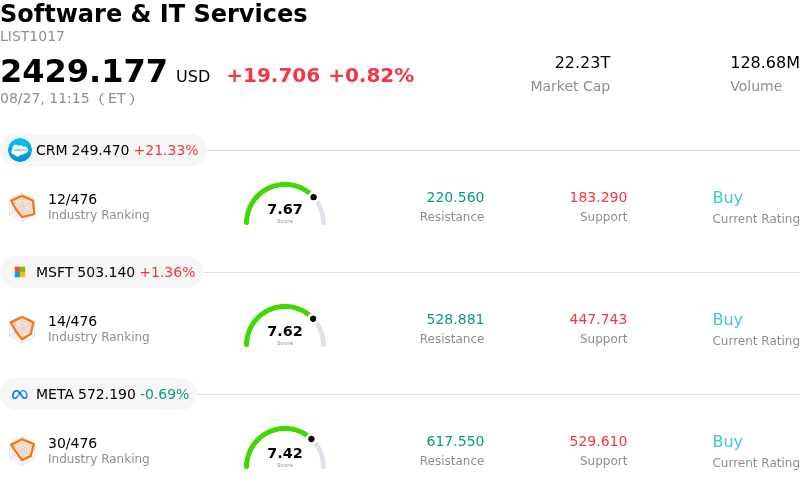
ServiceNow Inc (NOW) moved up by 8.96%. The Software & IT Services sector is up by 0.82%. The company outperformed the industry. Top 3 stocks by turnover in the sector: Salesforce Inc (CRM) up 21.33%; Microsoft Corp (MSFT) up 1.36%; Meta Platforms Inc (META) down 0.69%.
What is driving ServiceNow Inc (NOW)’s stock price up today?
ServiceNow experienced a strong upward surge driven primarily by broad-based momentum across the enterprise cloud software sector. Upbeat quarterly financial results and raised guidance from industry peer Salesforce served as a powerful sector-wide catalyst. The strong read-through reaffirmed institutional confidence that enterprise demand for artificial intelligence integration and digital transformation remains robust, easing broader market concerns regarding software disruption and reigniting investor appetite for leading software-as-a-service platforms.
Company-specific operational developments also provided significant tailwinds. ServiceNow recently expanded its strategic multi-year partnership with Tech Mahindra to pair its enterprise AI platform with implementation expertise, accelerating the deployment of production-ready agentic AI solutions across key verticals such as manufacturing, banking, and telecommunications. This initiative builds upon the company's rapidly expanding annual contract value derived from AI offerings, reinforcing market conviction in its ability to effectively monetize generative AI workflows.
Analyst upgrades and institutional positioning further supported today's rally. Multiple major Wall Street research firms have raised price targets and reiterated positive ratings on the stock, asserting that AI technologies represent a substantial long-term growth driver rather than a disintermediation threat to its platform. In addition, recent quarterly institutional portfolio disclosures highlighted increased accumulation by prominent funds, reflecting sustained buyer interest following the company's beat-and-raise financial performance.
Technical Analysis of ServiceNow Inc (NOW)
Technically, ServiceNow Inc (NOW) shows a MACD (12,26,9) value of 0.755, indicating a buy signal. The RSI at 68.222 suggests neutral condition and the Williams %R at 9.731 suggests overbought condition. Please monitor closely.
Media Coverage of ServiceNow Inc (NOW)
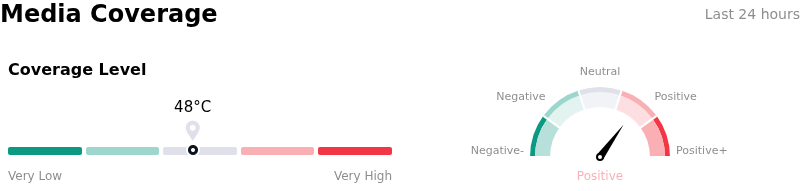
In terms of media coverage, ServiceNow Inc (NOW) shows a coverage score of 48, indicating a moderate level of media attention. The overall market sentiment index is currently in bullish zone.
Fundamental Analysis of ServiceNow Inc (NOW)
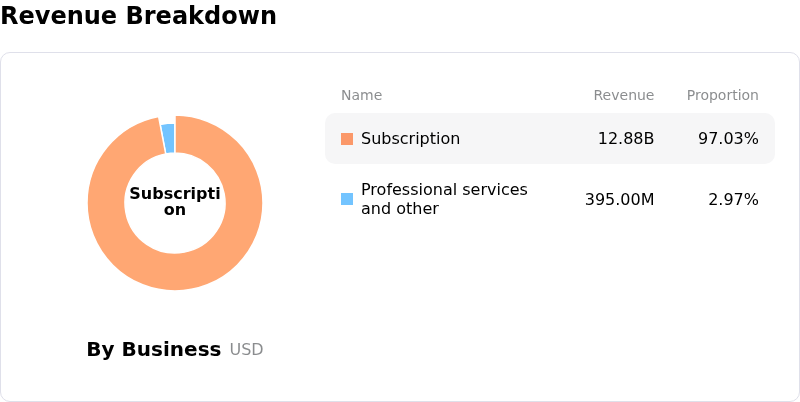
ServiceNow Inc (NOW) is in the Software & IT Services industry. Its latest annual revenue is $13.28B, ranking 28 in the industry. The net profit is $1.75B, ranking 30 in the industry. Company Profile
Over the past month, multiple analysts have rated the company as Buy, with an average price target of $145.89, a high of $248.00, and a low of $72.00.
More details about ServiceNow Inc (NOW)
Company Specific Risks:
- Elevated Valuation and Multiple Vulnerability: ServiceNow trades at an elevated trailing price-to-earnings ratio of approximately 78x to 80x, significantly above software industry peer averages, leaving the equity highly susceptible to intraday volatility and downward re-ratings if cRPO or subscription revenue growth fails to beat expectations.
- Disruption to Seat-Based Licensing from Autonomous AI: The acceleration of autonomous AI agents poses a direct threat to ServiceNow's core per-user software licensing model, creating analyst concern that enterprise clients will reallocate IT budgets to autonomous workflows that reduce required user seat counts.
- Executive Insider Share Liquidations: Recent SEC Form 4 regulatory filings reveal continued insider selling by senior management, including transactions by CEO Bill McDermott following RSU vestings, fueling caution among institutional investors.
- Acquisition Integration Costs and Margin Compression: Substantial capital outlays for enterprise acquisitions alongside heavy investments in AI cloud infrastructure are increasing integration expenses, creating near-term drag on operating margins prior to full monetization.
Recommended Articles


