


International Business Machines Corp Stock (IBM) Moved Up by 3.01% on Aug 27: What Signal Does It Send?
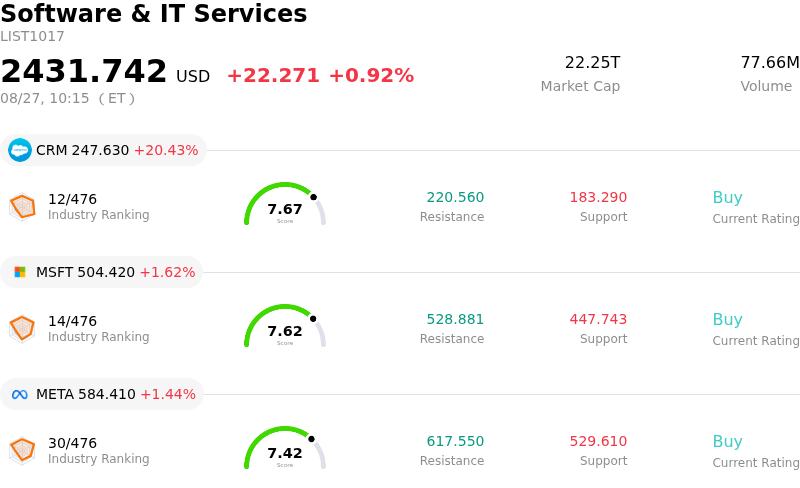
International Business Machines Corp (IBM) moved up by 3.01%. The Software & IT Services sector is up by 0.92%. The company outperformed the industry. Top 3 stocks by turnover in the sector: Salesforce Inc (CRM) up 20.35%; Microsoft Corp (MSFT) up 1.59%; Meta Platforms Inc (META) up 1.30%.
What is driving International Business Machines Corp (IBM)’s stock price up today?
International Business Machines demonstrated positive trading momentum as investor sentiment responded favorably to key strategic developments and valuation support. A primary catalyst for the upward movement was the completion of its acquisition of HRL Laboratories, a high-profile research organization. This transaction expands the company's quantum hardware capabilities by incorporating silicon-spin qubit technology alongside its existing superconducting architecture. The ongoing collaboration with major industrial partners in the aerospace and automotive sectors underscores the long-term strategic value of the deal, strengthening institutional confidence in the enterprise technology roadmap.
Rebounding demand from institutional investors also contributed to the upward trajectory following a period of post-earnings pressure. Market participants appear to be reassessing the stock's valuation relative to its fundamental cash flow generation. While previous quarterly results reflected temporary headwinds in mainframe hardware cycles and transaction software timing, the underlying momentum in hybrid cloud offerings through Red Hat and enterprise artificial intelligence solutions remains intact. Management's reaffirmed outlook for robust annual free cash flow growth and margin expansion provides a reassuring floor for value-oriented portfolios.
Intraday trading was marked by notable volatility, reflecting broader macroeconomic rebalancing across the large-cap technology sector. Fluctuations in broader equity indices and shifting interest rate expectations created alternating waves of buying and selling pressure throughout the session. Nevertheless, the company's resilient balance sheet, defensive cash profile, and steady dividend metrics helped absorb intraday sell-offs, allowing positive sentiment to prevail as institutional buyers stepped in on minor dips.
Technical Analysis of International Business Machines Corp (IBM)
Technically, International Business Machines Corp (IBM) shows a MACD (12,26,9) value of 1.988, indicating a neutral signal. The RSI at 51.836 suggests neutral condition and the Williams %R at 34.028 suggests buy condition. Please monitor closely.
Media Coverage of International Business Machines Corp (IBM)
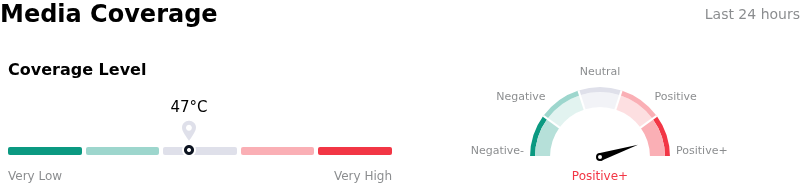
In terms of media coverage, International Business Machines Corp (IBM) shows a coverage score of 47, indicating a moderate level of media attention. The overall market sentiment index is currently in extremely bullish zone.
Fundamental Analysis of International Business Machines Corp (IBM)
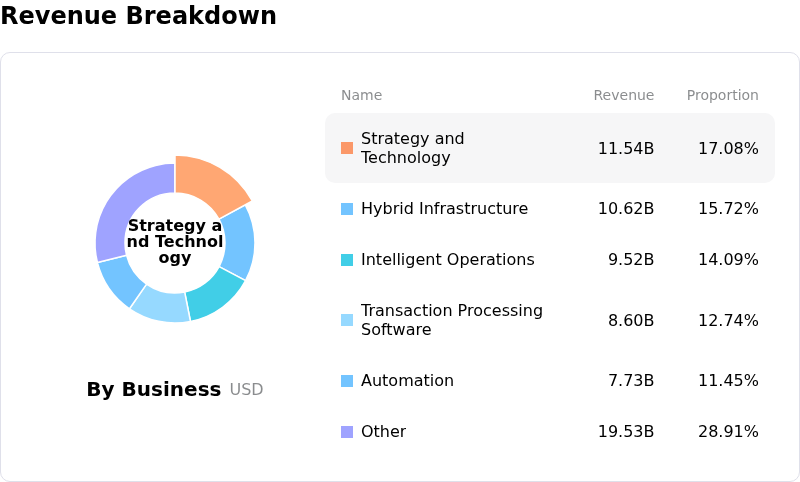
International Business Machines Corp (IBM) is in the Software & IT Services industry. Its latest annual revenue is $67.53B, ranking 7 in the industry. The net profit is $10.59B, ranking 11 in the industry. Company Profile
Over the past month, multiple analysts have rated the company as Buy, with an average price target of $244.07, a high of $350.00, and a low of $174.00.
More details about International Business Machines Corp (IBM)
Company Specific Risks:
- Mainframe Infrastructure Contraction: Enterprise customers are deferring major server and hardware upgrades due to rising data center supply costs, leading to a 42% drop in IBM Z system sales and forcing management to slash full-year revenue targets by over $600 million.
- Class Action Securities Fraud Investigations: Plaintiff law firms have launched formal securities fraud investigations into whether company leadership issued misleading public disclosures regarding deal closing timelines and product pipeline demand prior to the recent intraday sell-off.
- Enterprise Deal Delays and Stagnant Consulting Growth: Corporate IT spending shifts have caused numerous large transaction-processing software and consulting contracts to stall or fail to close on expected timelines, pinning total top-line revenue growth near 1%.
- Expanding Debt Obligations and Leverage Exposure: Recent 8-K SEC disclosures outlining C$2.75 billion in new debt issuance underscore reliance on capital markets to handle debt obligations and support liquidity amid depressed mainframe operating cash flows.
Recommended Articles


