


Solana (SOLUSD) Is up 4.33% on Aug 27: Why It Happened
Solana (SOLUSD) is up 4.33% at Aug 27 00:00(ET), now at $100.08, with a 7-day up of 15.58%.
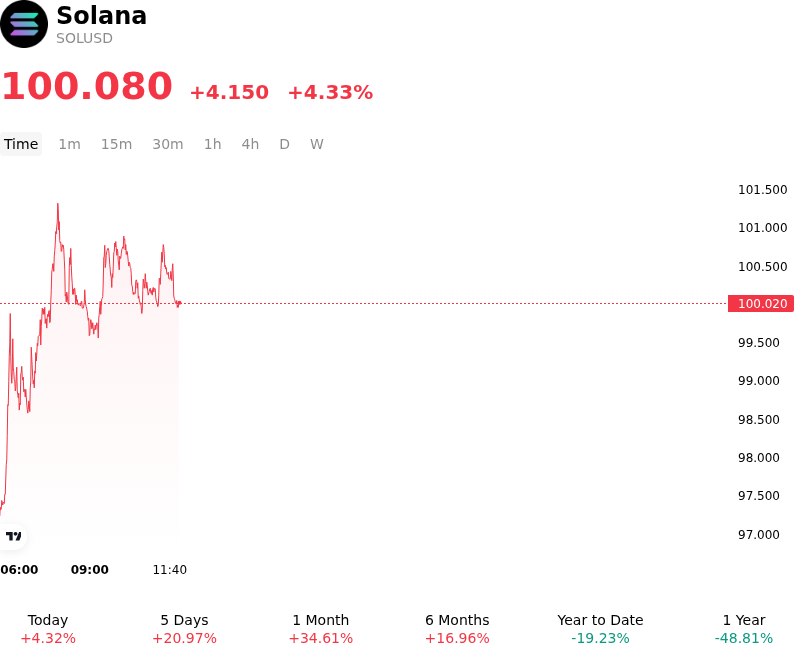
What is driving Solana (SOLUSD)’s stock price up today?
Capital inflows into Solana were primarily driven by a convergence of sustained institutional demand through spot ETF channels, favorable supply-side governance developments, and strong operational metrics across the network. Institutional participation picked up noticeably as spot Solana exchange-traded products recorded a multi-session streak of net inflows, pushing cumulative net flows to record levels. This institutional accumulation absorbed sell-side liquidity, supported by broader risk-on sentiment in digital asset markets following macro liquidity support measures from the United States Treasury and stabilizing long-duration bond yields.
Network-specific catalysts further amplified investor appetite. On-chain supply dynamics gained attention as validator voting on crucial governance proposals reached completion. The proposed tokenomic adjustments, which include doubling the annual disinflation rate to reduce scheduled token emissions alongside introducing a resource-based compute fee model, are designed to significantly increase the daily SOL burn rate. Investors repriced the token upward in anticipation of tighter net issuance, reinforced by robust ecosystem expansion where tokenized real-world assets on Solana surpassed key multi-billion-dollar milestones and transaction throughput sustained record volume.
Derivatives market positioning accelerated the upward trajectory through mechanical short covering. As spot buying pushed prices above key overhead technical resistance zones, elevated short-side liquidations across major derivatives exchanges forced automated buy-backs, expanding market depth and liquidity. While current price action demonstrates strong institutional absorption and ecosystem momentum, market participants continue to assess broader regulatory frameworks, issuer concentration within spot products, and overall macro liquidity to evaluate whether this movement marks a broader structural trend or a localized event-driven rally.
Technical Analysis of Solana (SOLUSD)
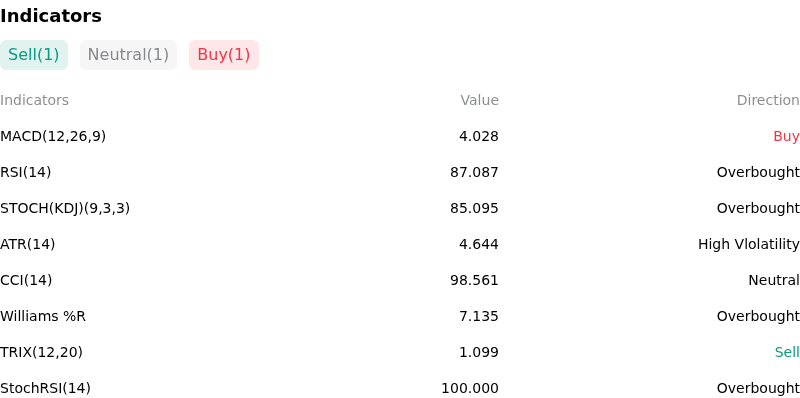
Technically, Solana (SOLUSD) shows a MACD (12,26,9) value of 4.028, indicating a buy signal. The RSI at 87.087 suggests overbought condition and the Williams %R at 7.135 suggests overbought condition. Please monitor closely.
More details about Solana (SOLUSD)
Recent Events and Risks:
- Resistance Rejection and Profit-Taking at Key Levels: SOL faced swift selling pressure and profit-taking after briefly testing the $100 psychological threshold, leaving the asset exposed to downside retests of lower support zones around $85 to $90 if spot accumulation fails to sustain recent gains.
- Elevated Derivatives Leverage and Liquidation Vulnerability: Open interest measured in SOL token terms remains historically elevated with high leverage build-ups, creating substantial downside volatility risk from long-liquidation cascades if price drops breach trader stop-loss clusters.
- Flow Asymmetry and Capital Rotation to Alternative Assets: Despite recent spot ETF inflows, monthly net institutional allocations into Solana products significantly lag major Layer 1 peers like Ethereum, keeping the SOL/ETH ratio suppressed below critical technical thresholds and risking capital rotation out of SOL.
- Governance Proposal Uncertainty and Validator Yield Risks: Ongoing validator votes covering major disinflation acceleration and transaction fee burn restructurings introduce operational and economic uncertainty regarding staking rewards, validator margins, and near-term network supply dynamics.
Recommended Articles


