


BNB (BNBUSD) Is up 1.03% on Aug 26: Why It Happened
BNB (BNBUSD) is up 1.03% at Aug 26 03:10(ET), now at $697.4, with a 7-day up of 12.10%.
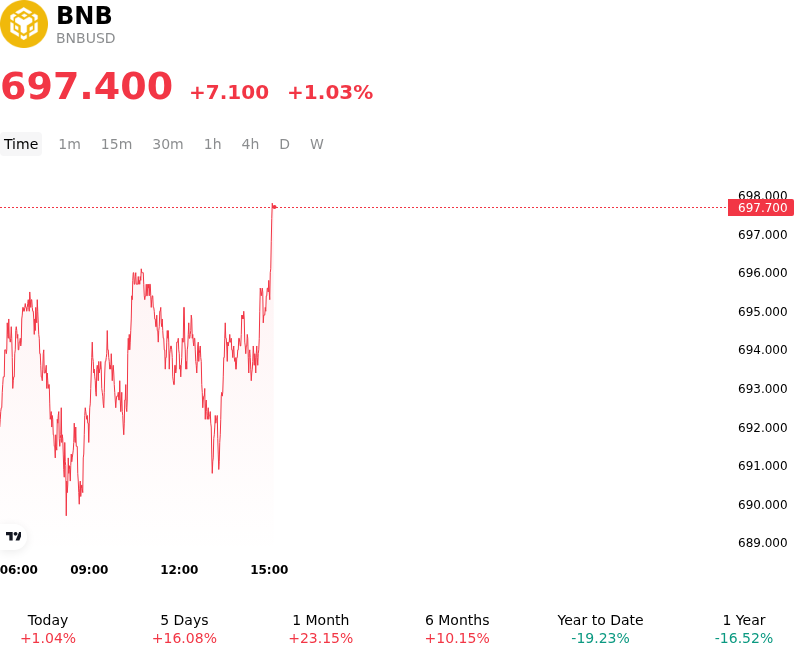
What is driving BNB (BNBUSD)’s stock price up today?
Capital flows into BNB strengthened as fundamental network improvements and positive platform developments bolstered investor sentiment across the ecosystem. A primary driver of the upward movement was the successful deployment of the Pasteur hard fork on the BNB Smart Chain mainnet. The protocol upgrade introduced key enhancements to cross-chain bridge security, tightened validator authorization protocols, and significantly expanded block throughput capacity. By reinforcing network infrastructure without compromising transaction speeds, the upgrade reassured institutional participants regarding the network's long-term scalability and security architecture, encouraging capital allocation into the native token.
Demand was further supported by expanding activity within the broader Binance trading ecosystem. The introduction of new spot trading features and tokenized product offerings stimulated user engagement and transaction volume across the platform. Because BNB serves as the primary utility asset for transaction fees, staking incentives, and ecosystem participation, elevated platform engagement directly translated into organic spot market buying pressure. Concurrently, broader macroeconomic conditions provided a favorable backdrop, as lower Treasury yields and a modestly weaker US dollar supported liquidity conditions and risk-on sentiment across major digital assets.
Derivatives positioning and technical structure also contributed to the positive price action. Defending key psychological support levels above 700 USD triggered systematic short covering in perpetual futures markets, driving a moderate squeeze in leveraged positions. While the recent gain reflects strong underlying network fundamentals and sustained exchange utility, investors continue to monitor potential regulatory developments affecting centralized exchange platforms, long-term validator decentralization, and shifts in global monetary policy that could impact overall crypto liquidity.
Technical Analysis of BNB (BNBUSD)
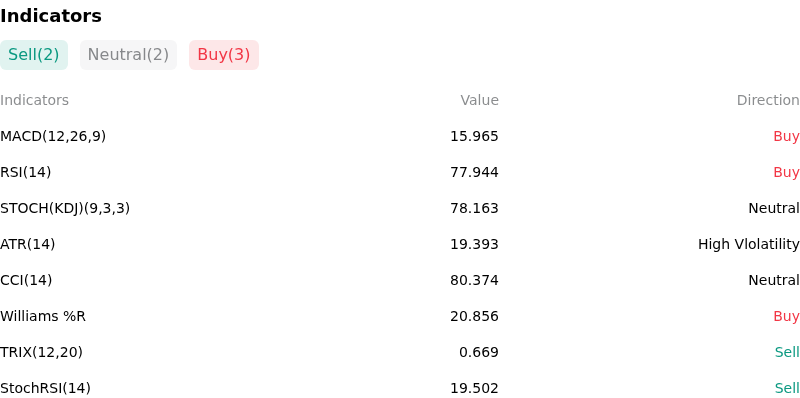
Technically, BNB (BNBUSD) shows a MACD (12,26,9) value of 15.965, indicating a buy signal. The RSI at 77.944 suggests buy condition and the Williams %R at 20.856 suggests buy condition. Please monitor closely.
More details about BNB (BNBUSD)
Recent Events and Risks:
- Exchange Sanctions Enforcement and Counterparty Restrictions: Following Binance's enforcement of transaction blocks against 16 non-compliant crypto platforms—including major exchanges like HTX and EXMO—in response to EU, UK, and US sanctions, users attempting transfers face automated compliance reviews and temporary wallet freezes, creating counterparty friction and potential liquidity disruptions.
- Heavy Overhead Resistance and Leverage Liquidation Exposure: Despite recent short-squeeze rallies toward key technical psychological zones, price action faces dense overhead resistance between $650 and $700. Fading spot buying volume leaves leveraged derivative positions vulnerable to sudden long liquidation cascades if key support levels down to $586 break.
- Subdued Institutional ETF Inflows and High Macro Beta: BNB's intraday price movements remain heavily reliant on broad crypto market liquidity shifts rather than coin-specific catalysts, while demand from spot BNB ETF vehicles remains modest, leaving the token exposed to sharp pullbacks if broader macroeconomic risk-off sentiment returns.
- Operational Friction from Protocol Upgrades and Pair Delistings: Recent network hard fork activations on the BNB Smart Chain, combined with scheduled Binance exchange housekeeping that includes delisting select spot and margin trading pairs (such as LTC/BNB and SUI/BNB), have introduced temporary wallet deposit/withdrawal pauses and forced margin unwinds that exacerbate localized intraday volatility.
Recommended Articles


