


Vertiv Holdings Co Stock (VRT) Opened Up by 3.65% on Aug 25: What Signal Does It Send?
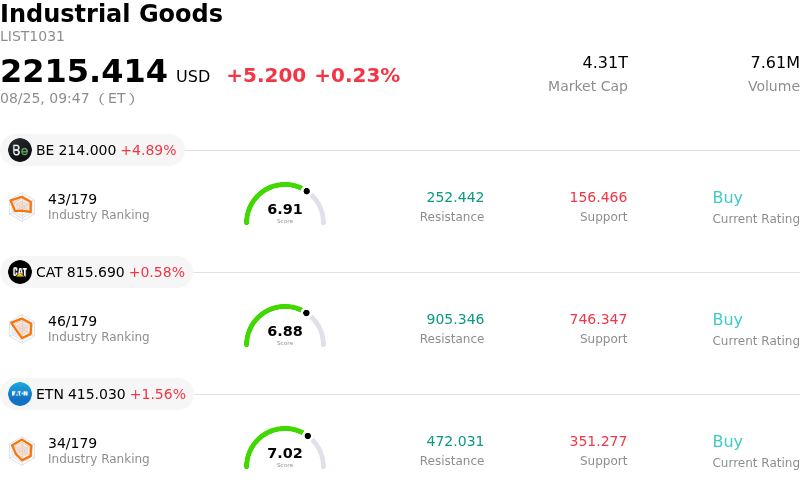
Vertiv Holdings Co (VRT) opened up by 3.65%. The Industrial Goods sector is up by 0.23%. The company outperformed the industry. Top 3 stocks by turnover in the sector: Bloom Energy Corp (BE) up 3.27%; Caterpillar Inc (CAT) up 0.58%; Eaton Corporation PLC (ETN) up 1.56%.
What is driving Vertiv Holdings Co (VRT)’s stock price up today?
Vertiv Holdings experienced noticeable upward momentum accompanied by heightened intraday volatility, as renewed institutional interest in artificial intelligence infrastructure providers catalyzed buying activity. Following a temporary consolidation period, investor sentiment swung back toward critical digital infrastructure leaders. Demand for liquid cooling systems and high-density power management solutions remains robust, driven by hyperscale data center expansions and accelerating hardware adoption across the broader AI ecosystem.
Positive momentum was further supported by corporate announcements and ongoing analyst endorsements highlighting the company's long-term earnings potential. Management's scheduled participation in upcoming major technology investor conferences served as a reminder of the company's strong operational leverage and leadership position in next-generation thermal management. Additionally, recent institutional portfolio disclosures and favorable earnings revisions from Wall Street research firms underscored growing market confidence in the company's upgraded full-year financial targets and expanding operating margins.
Looking ahead, intraday price swings reflect an ongoing tug-of-war between growth investors capitalizing on structural AI tailwinds and cautious market participants evaluating premium valuation metrics. While elevated volatility may persist due to broader tech sector rotations and macroeconomic developments, the company's expanding order backlog, strategic global manufacturing expansions, and vital role in resolving thermal bottlenecks for compute-intensive workloads continue to underpin a constructive outlook.
Technical Analysis of Vertiv Holdings Co (VRT)
Technically, Vertiv Holdings Co (VRT) shows a MACD (12,26,9) value of -1.054, indicating a sell signal. The RSI at 44.706 suggests neutral condition and the Williams %R at 70.157 suggests sell condition. Please monitor closely.
Media Coverage of Vertiv Holdings Co (VRT)
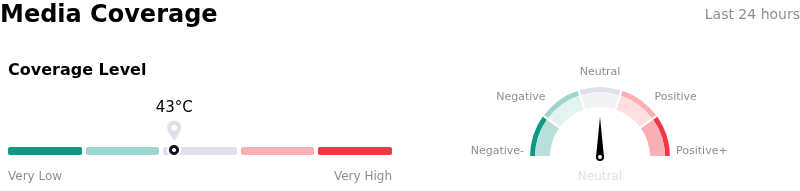
In terms of media coverage, Vertiv Holdings Co (VRT) shows a coverage score of 43, indicating a moderate level of media attention. The overall market sentiment index is currently in neutral zone.
Fundamental Analysis of Vertiv Holdings Co (VRT)
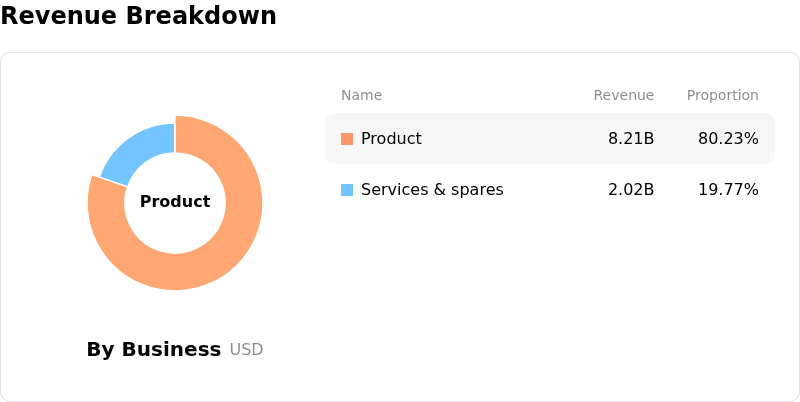
Vertiv Holdings Co (VRT) is in the Industrial Goods industry. Its latest annual revenue is $10.23B, ranking 17 in the industry. The net profit is $1.33B, ranking 13 in the industry. Company Profile
Over the past month, multiple analysts have rated the company as Buy, with an average price target of $331.02, a high of $400.00, and a low of $188.00.
More details about Vertiv Holdings Co (VRT)
Company Specific Risks:
- Complex Deployment & Revenue Recognition Execution Risks: Supply chain congestion and multi-phased project execution delays in large-scale AI data center deployments have created revenue timing shifts, forcing Vertiv to rely on aggressive second-half revenue catch-up and increasing vulnerability to quarterly execution misses.
- Elevated Valuation & Multiple Compression Exposure: Trading at a premium forward P/E ratio exceeding 40x, the stock leaves little margin for error, prompting recent price target cuts from major brokerages including Citi, RBC, and KeyCorp to reflect heightened risk of multiple contraction upon operational hiccups.
- Macroeconomic & Treasury Yield Sensitivity: Vertiv's high-multiplier AI hardware infrastructure narrative leaves it acutely vulnerable to benchmark U.S. Treasury yield spikes and broader industrial economic slowdowns, driving swift institutional profit-taking during tech sector rotations.
- Heavy Insider Divestment: Substantial insider selling totaling over $140 million over the past year with no recorded insider purchases signals internal caution regarding near-term upside potential at current price multiples.
Recommended Articles


