


Ethereum (ETHUSD) Is up 1.19% on Aug 21: Key Drivers to Watch
Ethereum (ETHUSD) is up 1.19% at Aug 21 00:15(ET), now at $2343.72, with a 7-day up of 24.80%.
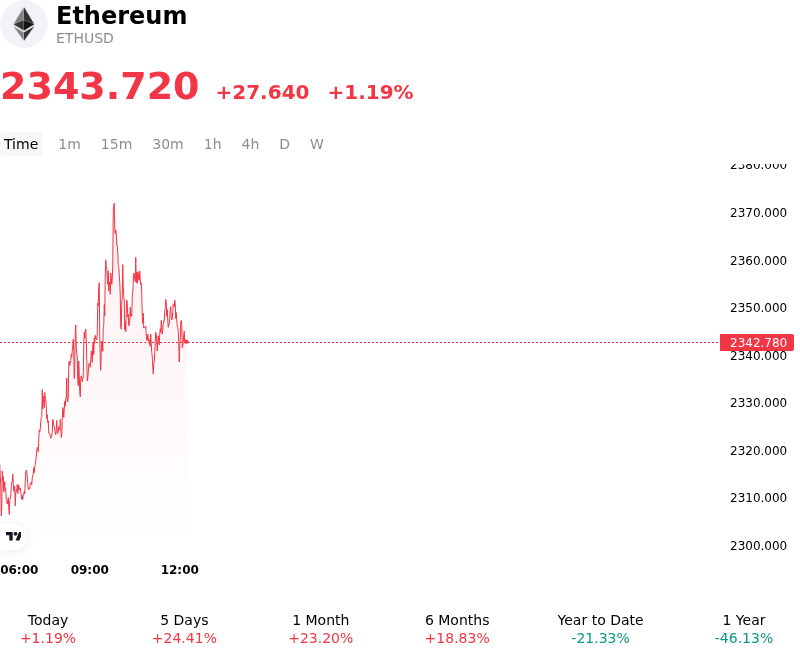
What is driving Ethereum (ETHUSD)’s stock price up today?
Capital flowed into Ethereum as macro liquidity conditions eased and spot ETF demand surged. The primary catalyst driving the broader crypto landscape has been a shift in macroeconomic policy, marked by expanded Treasury bond buybacks that lowered long-term yields and applied downward pressure on the US dollar. This environment improved global liquidity and prompted institutional investors to rotate into higher-beta digital assets. Concurrently, spot Ethereum ETFs experienced a substantial resurgence in daily net inflows, signaling a clear resumption of institutional positioning and providing a solid spot-driven bid.
The advancement was further reinforced by technical market dynamics and derivatives positioning. Ethereum moved decisively above critical short- and medium-term resistance levels, supported by a significant expansion in spot trading volume. This structural breakout triggered a wave of short covering and the liquidation of leveraged short positions, accelerating buying pressure across major exchanges. As spot demand absorbed available liquidity at higher price tiers, derivatives markets reflected a fast repricing of risk sentiment, transforming initial spot accumulation into a broader momentum-driven push.
Underpinning this move is renewed optimism around Ethereum’s technical roadmap and ecosystem scalability. Successful progress on public testnet deployments, such as rehearsals for upcoming protocol upgrades focusing on enshrined proposer-builder separation and parallel execution capabilities, has strengthened medium-term adoption expectations. While near-term momentum remains robust, institutional market participants continue to monitor whether elevated ETF inflows and spot volume can sustain these higher price levels, or whether overbought technical conditions and macro volatility could introduce periodic consolidation.
Technical Analysis of Ethereum (ETHUSD)
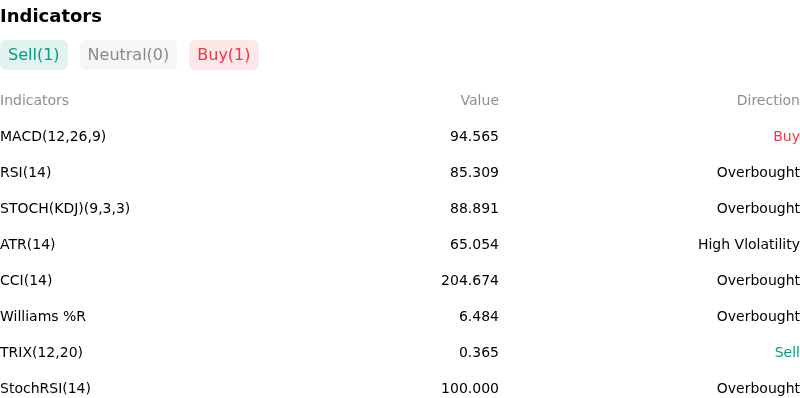
Technically, Ethereum (ETHUSD) shows a MACD (12,26,9) value of 94.565, indicating a buy signal. The RSI at 85.309 suggests overbought condition and the Williams %R at 6.484 suggests overbought condition. Please monitor closely.
More details about Ethereum (ETHUSD)
Recent Events and Risks:
- Derivatives-Driven Squeeze Vulnerability: Following a sudden intraday surge propelled by over $1.1 billion in ETH short liquidations, market structure analysis indicates the move was heavily driven by forced short-covering rather than organic spot buying, leaving ETH vulnerable to a rapid bull trap unwinding if momentum fades.
- On-Chain Cost Basis Supply Overhead: On-chain data shows Ethereum approaching its aggregate Realized Price near $2,300—representing the average market cost basis—triggering profit-taking and selling pressure from break-even investors seeking liquidity after prolonged range-bound trading.
- Whale Distribution and Exchange Deposits: On-chain tracking reveals persistent distribution from large holders and dormant whale wallets transferring significant amounts of ETH to centralized exchanges, introducing substantial sell-side inventory and capping upward price continuation.
- Unbalanced Long Position Concentration: Top exchange derivatives data shows long/short account ratios heavily skewed toward long positioning, creating downside fragile leverage conditions that could trigger secondary liquidation cascades if key psychological support levels are breached.
Recommended Articles


